

Cardano (ADA) has witnessed a significant outflow of tokens from large holders, with over 4 million ADA sold in the past week, according to on-chain analyst Ali Martinez. This sell-off coincides with a period of declining price action for ADA, which has fallen by more than 10% in the last seven days.
Despite a short-lived price bounce within a 24-hour period, the broader trend for Cardano remains under pressure.
Whale Holdings Decrease as Price Declines
Wallets holding between 100,000 and 1,000,000 ADA have notably reduced their positions since late October. This period of reduction aligns with a fall in ADA's price, which has dropped from above $0.60 to approximately $0.53.
Whales have offloaded more than 4 million Cardano $ADA in the past week! pic.twitter.com/KsiZgNX1Jw
— Ali (@ali_charts) November 7, 2025
This trend is evident in on-chain data, which shows a decrease in the aggregate holdings of this investor group. The selling activity contributes to the existing downward pressure on ADA's price, which has been experiencing a decline over the past week. Previous reports indicated that large holders have been gradually reducing their exposure to ADA over recent weeks. In the absence of substantial buying interest to absorb this supply, price levels may continue to face pressure.
Weak Sentiment, but Early Buy Signal Appears
The overall social and market sentiment surrounding ADA is currently negative. Market Prophit indicated a bearish outlook, with both retail sentiment and model-based signals pointing towards the downside.
However, Ali Martinez has highlighted a potential shift, noting that the TD Sequential indicator on the 3-day chart has presented a possible buying opportunity for ADA. The pattern has shown a red "9" candle, a signal often observed near the conclusion of a downward price movement. While this does not definitively confirm a reversal, it may suggest that the recent sell-off is beginning to decelerate.
Concurrently, technical indicators suggest that ADA is approaching oversold territory. The Relative Strength Index (RSI) currently stands at 34.62, a level close to the common oversold threshold of 30. Historically, RSI levels in this range have been associated with short-term price bounces.
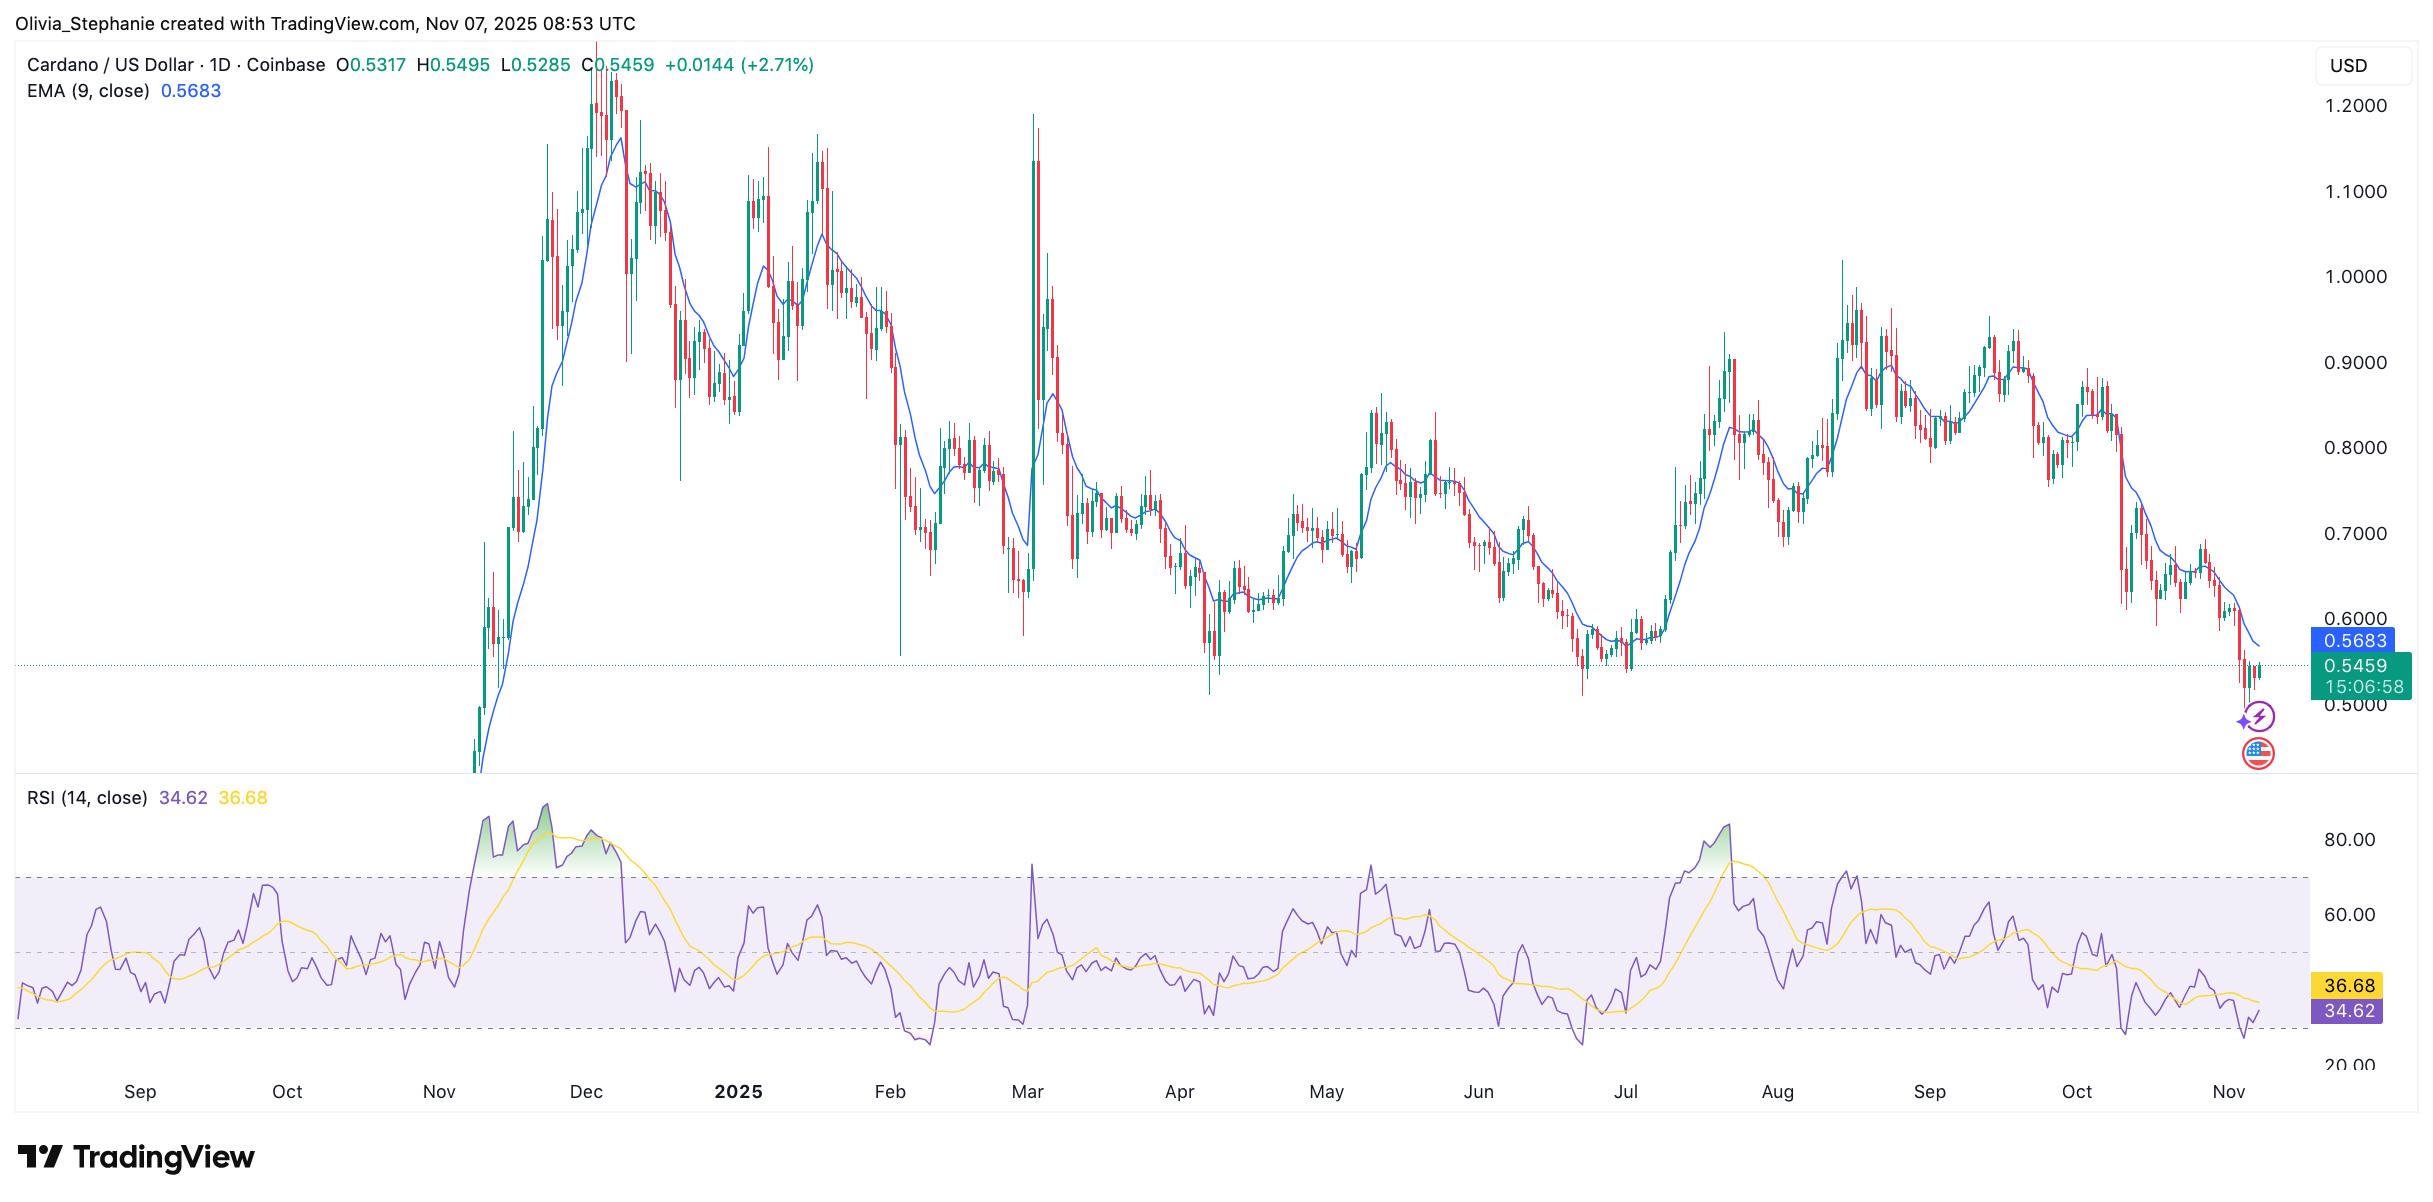
ADA is presently trading below its 9-day Exponential Moving Average, which is positioned at $0.57. A reclaim of this level would be necessary to indicate any positive shift in short-term momentum. Until then, the prevailing trend remains weak.
Focus on Technical Support Zones
Technical charts from Lucky indicate that ADA is holding at a critical trendline near the $0.50 mark. This level falls within a demand zone that has historically provided support for the price. Previous analysis also noted that this area has attracted buying interest in the past.
A breakout above this zone could potentially lead to higher price targets, including a return to $1.30. Lucky expressed a positive outlook, stating that ADA "is looking good here," provided that the current support level holds firm. A failure of this support would invalidate the current bullish setup.