
Technical Analysis
Bollinger Bands
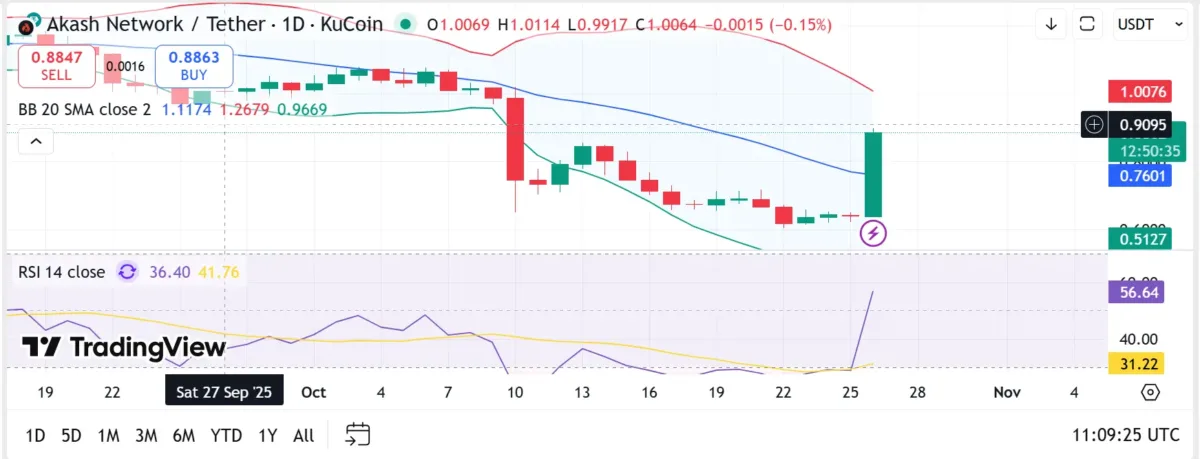
Akash Network (AKT) is currently trading near the lower Bollinger Band. This positioning suggests potential oversold conditions or the beginning of a consolidation phase. The upper band is observed at $1.12, the middle band (representing the 20-day Simple Moving Average) is at $0.89, and the lower band is situated at $0.77.
A recent squeeze in the Bollinger Bands indicates a reduction in market volatility, a pattern that often precedes a significant directional price movement. If buyers can successfully drive the price above the middle band of $0.89, it could trigger a rally towards the $1.27 resistance level. Conversely, a failure to maintain a position above the lower band might lead to further price declines, potentially testing the $0.70 mark.
RSI Behavior
The Relative Strength Index (RSI) for AKT is currently at 36.4. This reading places the asset in a neutral-to-bearish territory, indicating that while selling pressure is diminishing, there is not yet sufficient buying strength to signal a definitive reversal.
The moving average RSI is slightly higher at 41.76, suggesting a cautious market sentiment. A sustained move of the RSI above 50 in the upcoming days could signify a shift towards bullish momentum, potentially encouraging traders to pursue higher price targets.
Support and Resistance Levels
The immediate support level for AKT is identified at $0.77, which aligns with the lower boundary of the Bollinger Bands. This level is considered a crucial buying zone where upward price pressure may re-emerge.
On the resistance side, the first significant hurdle is at $1.27, which coincides with the 20-day SMA. A decisive break above this resistance level would be a strong indicator of a potential trend reversal, possibly propelling AKT towards $1.50. If upward momentum persists, the next major resistance to watch is at $1.72, which could serve as a key breakout target for AKT.
Akash Network (AKT) Price Prediction 2025–2029
| Year | Minimum Price | Average Price | Maximum Price |
| 2025 | $0.70 | $1.20 | $1.50 |
| 2026 | $1.50 | $2.00 | $2.50 |
| 2027 | $2.50 | $3.50 | $4.00 |
| 2028 | $4.00 | $5.50 | $6.50 |
| 2029 | $6.50 | $8.00 | $10.00 |
2025: In 2025, AKT is projected to trade within a range of $0.70 to $1.50, indicating a period of consolidation following recent volatility. The current neutral RSI reading and the narrowing Bollinger Bands suggest an upcoming increase in volatility, which could lead to upward price momentum if key support levels around $0.77 are successfully defended by buyers.
2026: By 2026, Akash Network's growing prominence in the decentralized cloud computing sector is expected to attract increased interest from both institutional and retail investors. The price is forecast to reach an average of $2.00, with the potential to surpass the $2.50 mark if market sentiment continues to improve.
2027: Further adoption of decentralized cloud services and the continuous expansion of Akash's network infrastructure could drive AKT prices upward, potentially reaching an average of $3.50 and possibly hitting $4.00 as the asset gains broader market recognition among individual and institutional participants.
2028: As decentralized cloud computing and Web3 technologies mature and gain wider adoption in 2028, AKT could experience heightened demand. Price expectations suggest an average of $5.50, with a potential peak of $6.50 if the rate of adoption accelerates significantly.
2029: By 2029, assuming Akash Network successfully expands its ecosystem and maintains its leadership position in decentralized cloud computing, AKT could reach price points between $8.00 and $10.00. This projection reflects the anticipated growing demand for decentralized infrastructure solutions as more organizations transition away from traditional cloud service providers.
Conclusion
Akash Network (AKT) is currently positioned near a critical support level, displaying signs of consolidation after a period of significant price fluctuations. The tightening Bollinger Bands suggest a decrease in market volatility, while the RSI indicates that bearish momentum is weakening, potentially signaling an upcoming reversal if buying pressure intensifies.
A successful break above the $1.27 resistance level could lead AKT to target $2.00 in the short term. Looking ahead to the period between 2025 and 2029, the continued growth of decentralized cloud computing and Web3 technologies is expected to support sustained price appreciation for AKT, with a potential to reach $10 by 2029.
FAQs
1. Why did AKT drop recently?
The recent decrease in AKT’s price was influenced by broader market trends. AKT experienced a temporary dip below the 20-day SMA but has since stabilized.
2. Is AKT oversold right now?
With an RSI of 36.4, AKT is not yet in oversold territory but is approaching levels where increased buying interest might emerge, suggesting potential for a rebound.
3. What is the next key resistance level for AKT?
The next significant resistance level for AKT is at $1.27, which aligns with the 20-day SMA. A breakout above this point could propel AKT towards $1.50 and higher.
4. Can AKT reach $10 by 2029?
If Akash Network continues to advance within the decentralized cloud computing sector and sees increased adoption, reaching $10 by 2029 is a plausible target, driven by growing demand and expanding use cases.
5. Is AKT a good long-term investment?
Considering its strong position in the decentralized cloud market and the rising demand for Web3 solutions, AKT appears to be a promising long-term investment. However, investors should anticipate potential short-term price volatility.