

ALTS is moving through a period of heavy market pressure as its price structure weakens. Current market conditions show reduced demand, low confidence, and unstable liquidity within a micro-cap environment.
- •ALTS trades near extreme lows after a steep monthly drop, reflecting sharp pressure in a thin micro-cap market.
- •Russell 2000 strength offers a contrasting risk signal as ALTS volume rises despite weak price performance.
- •Limited holders and high supply circulation contribute to unstable price behavior in the ALTS market.
RUT Breakout Adds Context to ALTS Market Behavior
A post from CryptoBullet notes that the Russell 2000 index has broken above a multi-year resistance line. The post observes that the index has moved through structural barriers that suppressed small-cap performance since late 2021. This movement creates a backdrop that contrasts with the current posture of ALTS.
The RUT chart shows a large double rounded bottom that formed over two years. Each trough formed in mid-2022 and mid-2023. The formation suggests steady accumulation. Buyers stepped in when small-cap sentiment stayed weak. The index moved toward the 2,450 to 2,500 resistance zone, a region that often stopped momentum. The new advance shows stronger stability above that zone.
The message from CryptoBullet adds that the index completed a breakout-retest-reclaim pattern. This type of movement suggests demand has returned to small-cap equities. The post ties this trend to broader risk appetite. The message states that strong small-cap behavior often aligns with periods when altcoins perform better. The contrast becomes clear as ALTS trades near depressed levels despite the improved broader risk context.
ALTS Shows Heavy Stress in Current Market Structure
Crypto-Altcoins.com ALTS trades far below previous levels. The current price of $0.059409 reflects a deep 77.88% monthly drawdown. The token’s market cap stands near $12.51K. This valuation places ALTS in a fragile zone where small trades move the market sharply. The low market depth creates unstable price action.
ALTS registered $2.15K in 24-hour volume. This number rose 44.58% from earlier levels. The increase appears large compared to the small base figure. However, micro-cap markets often record erratic volume patterns. A single wallet may produce sharp volume changes. The Vol/Mkt Cap ratio of 17.2% indicates activity relative to capitalization. Yet such activity may not show broad interest.
The supply structure expands the pressure on the token. ALTS has 1.33B tokens in circulation out of a 1.53B maximum. The near-complete supply release reduces dilution risk. At the same time, it means most tokens already move through the market. Oversupply can weaken support when demand is low. Holder data shows only 253 wallets. This concentration allows large wallets to influence liquidity and price direction without resistance.
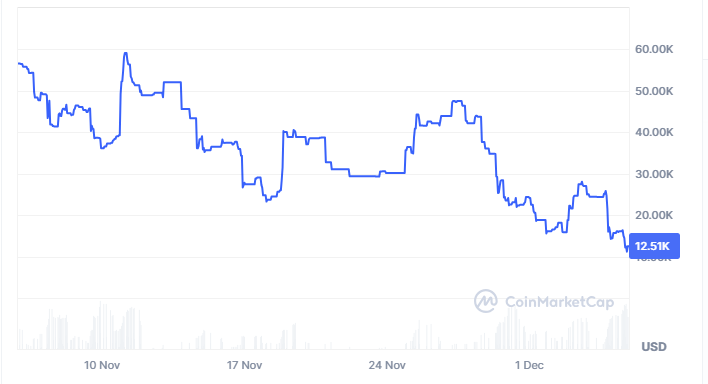
Historical Chart Data Shows Fading Momentum in ALTS
The long-term chart shows previous market cap levels near the $40K to $60K range. Those levels do not appear sustainable as the chart moves through 2024 and into late 2025. The downward structure shows repeated lower highs. This pattern suggests that attempts to regain momentum met steady selling pressure. The chart shows no strong period of sustained accumulation in recent months.
The downward slide also shows reduced buying interest. The price movements grow sharper as liquidity thins. Such conditions allow isolated trades to shift the market. The limited number of holders adds to this pattern. When new liquidity does not enter the market, price support weakens quickly. ALTS reflects a market losing volume depth.
The chart structure also contrasts sharply with the pattern described in the Russell 2000 breakout. The RUT shows a well-formed base and a structured advance. ALTS shows no such pattern. Instead, the chart appears reactive. Price moves without forming solid consolidation areas. This difference shows why the token faces stress while broader small-cap sentiment shifts.