

Key Insights
- •ASTER has broken out of a long-term channel, suggesting a potential move towards previous highs around $2.80.
- •The price is currently facing significant resistance near the $1.30 mark, and a breakout or rejection at this level will dictate the short-term trend.
- •There is notable buying interest in the $1.13–$1.10 range, with traders looking to accumulate dips and set targets above $1.45.
Aster (ASTER) is attracting attention following a significant move above a critical level on its daily chart. The token was trading at approximately $1.26, marking a 2.7% increase over the last 24 hours and a 12.3% rise over the past week, according to recent data. Traders are now closely observing for sustained momentum that could propel the price to new all-time highs.
Daily Breakout Signals Growing Interest
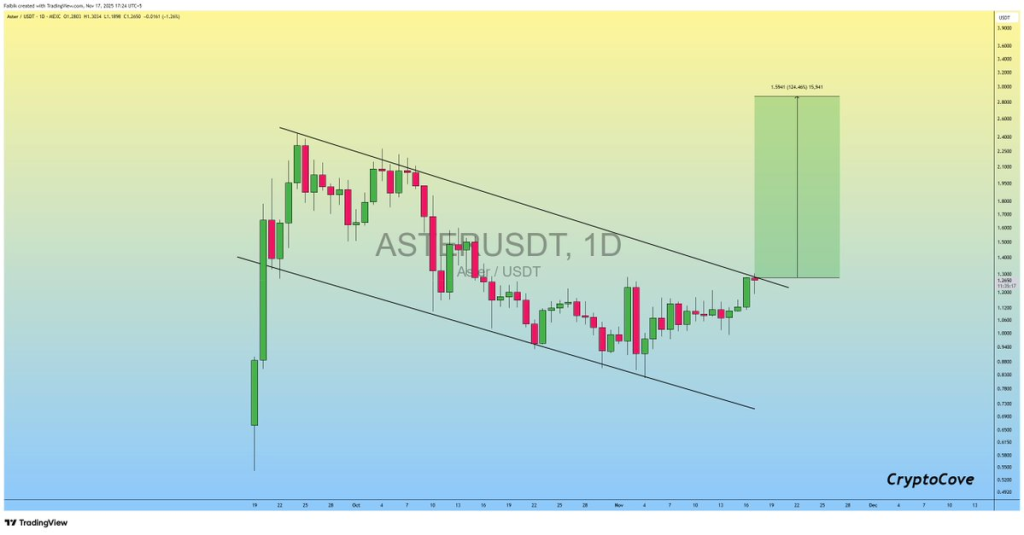
ASTER has successfully moved above the upper boundary of a falling channel that had been in formation since late September. This breakout occurred around the $1.25 level, with a subsequent daily close confirming the upward movement. The breakout was supported by a strong green candle, indicating significant buyer activity.
Analyst Captain Faibik commented on the development:
“If channel breakout confirms, we can expect a new all-time high in the coming days.”
A confirmed breakout, with sustained support above this zone, could pave the way for a rally towards the $2.80 mark, a target derived from the previous trading range’s amplitude. Traders will be looking for a potential retest of the channel line to act as support before any further upward movement.
Support Zone Identified Between $1.13 and $1.10
Short-term trading strategies are indicating demand in the lower price range, with trader Tareeq placing buy orders between $1.131 and $1.100. This area coincides with a previous breakout level and has historically served as support. Tareeq indicated a disciplined risk approach, stating he is “risking 2% if fully filled.”
Should the price experience a pullback into this range, it could present a new entry opportunity for buyers anticipating higher prices. The potential upside from this support zone could extend towards $1.46, a target marked on the chart. This level has not been retested since the initial breakout.
Resistance Holding Firm Near $1.30
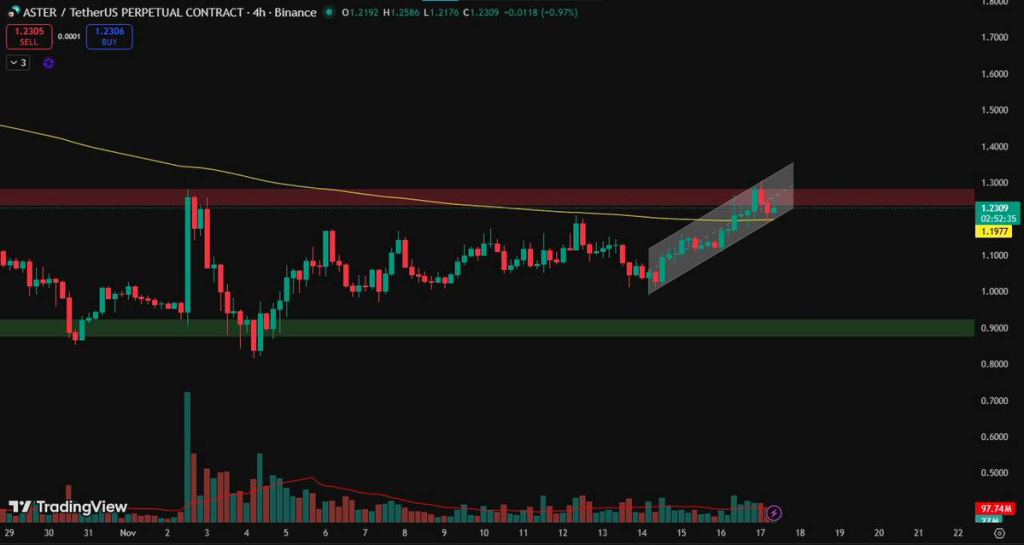
On the 4-hour chart, ASTER is currently positioned within a rising channel and is confronting a critical resistance zone situated between $1.24 and $1.30. This area has previously acted as a supply zone and aligns with the 200-period moving average, which could potentially impede any breakout attempts.
Analyst Mayank Dudeja highlighted that the price is encountering a barrier on higher timeframes. He suggested that a rejection at this level could lead to a decline towards $1.18 or $1.12. Conversely, a break below the channel might push the price down to the $0.92–$0.98 range, which has previously served as a support base. If ASTER manages to break above $1.30, potential targets at $1.36 and $1.42 could become relevant.
Next Price Movement Hinges on the $1.30 Level
While shorter-term charts indicate bullish sentiment, ASTER is currently consolidating at a significant resistance zone. A decisive move above $1.30, accompanied by substantial trading volume, could signal a continuation of the upward trend. Until this key level is breached, traders will be monitoring for either a breakout or a rejection to determine the asset's next directional move.
| DISCLAIMER: The information provided on this website is intended for general market commentary and does not constitute investment advice. We strongly encourage users to conduct their own thorough research before making any investment decisions. |