

Aster (ASTER) is currently trading within a confined range following a retreat from its recent peak of nearly $1.20. The asset has now established a descending wedge pattern, a technical formation that frequently precedes bullish reversals, particularly when accompanied by robust volume and price stability.
The current price of ASTER is $1.09, marking a 5.33% decrease over the past 24 hours. Trading volume for the same period amounts to $585 million. Market participants are closely observing the support zone between $1.05 and $1.10, which is expected to be a critical factor in determining the asset's future price trajectory.
Descending Wedge Develops as Key Resistance Levels Hold
Aster has recently encountered resistance and been rejected from the $1.20 zone for a second time. This price area has previously acted as a significant ceiling in prior trading sessions. According to analyst Ardi, the price has been characterized by lower highs and lower lows since it lost its long-term trendline. These movements have collectively formed a descending wedge pattern on the price chart.
Price action has been compressing, leading to reduced volatility. The support at the 61.8% Fibonacci retracement level, situated around $1.05, has so far held firm. This level is generally considered a healthy pullback zone within technical setups, provided it is not breached. A decisive breakdown below $1.05 could expose Aster to further price declines, potentially testing the $1.00 level.
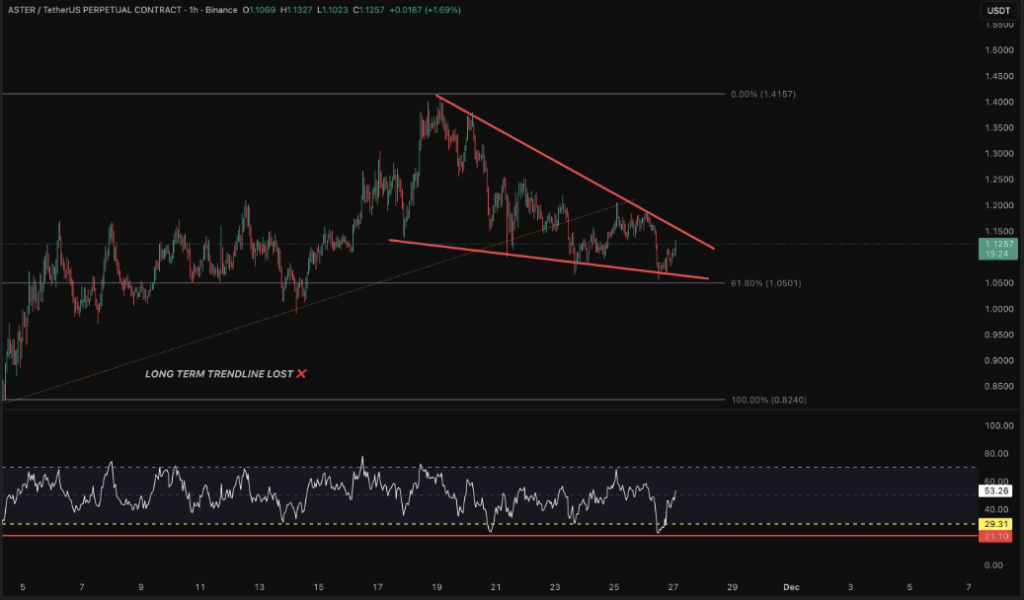
During its most recent upward movement, Aster was unable to reclaim a position above the 38.2% Fibonacci level, which is approximately $1.18. Sellers appear to be actively defending this range, effectively confining the asset within the current wedge formation. The region between $1.18 and $1.20 continues to represent strong resistance that bulls must overcome to sustain any upward momentum. Should this resistance be cleared, potential price targets ranging from $1.26 to $1.41 may become attainable, based on previous reaction highs.
RSI Near Long-Term Support as Whale Activity Draws Attention
As noted by Ardi, the Relative Strength Index (RSI) is currently positioned near a significant long-term support level. This level has historically provided support during previous market corrections. Some analysts interpret this proximity to support as a potential indicator of buyer exhaustion or an impending bounce.
Whale Activity Signals Strong Confidence in Current Price Levels, Indicating Potential for Continued Market Stability
Data from BeingInvested indicates that a high-balance wallet is maintaining a substantial long position in Aster. This wallet holds an open long position valued at $34.1 million with 5x leverage and no accompanying short positions. The current value of this position is $4.74 million, with an entry price recorded at $1.19.
This significant whale activity has captured the attention of market observers. One trading account commented, "Whale moves all in," suggesting a strong conviction behind this position. The market is now anticipating the next directional move as Aster approaches the apex of the descending wedge. Traders are diligently monitoring the support zone levels to identify the next potential breakout or breakdown.