

Key Market Insights
- •Traders are closely monitoring the $0.95 support level as ASTER tests a major floor amidst ongoing market weakness.
- •Funding rates have remained predominantly neutral, suggesting that long positions are being held despite the current price slide.
- •The Relative Strength Index (RSI) and Moving Average Convergence Divergence (MACD) indicators are showing weak momentum, signaling downward pressure while buyers await a confirmed reversal signal.
Current Price Action and Support Levels
ASTER was trading at $0.9489, holding at a closely watched support area near the $0.95 mark. This level has historically served as a demand zone, with the price repeatedly testing it without a sustained break below. The asset has experienced a consistent downtrend over the past month, declining from approximately $1.50 to below $1.00. However, each approach to the $0.95 level has seen buyers re-enter the market. Market participants are now keenly observing this level to determine if it will hold once again.
Market Behavior and Derivatives Data
Trading activity in the last 24 hours shows a slight decrease of -0.02%, while the weekly change indicates a 2.7% gain. The trading volume remains above $308 million, demonstrating continued interest in the asset, although its directional conviction is still uncertain.
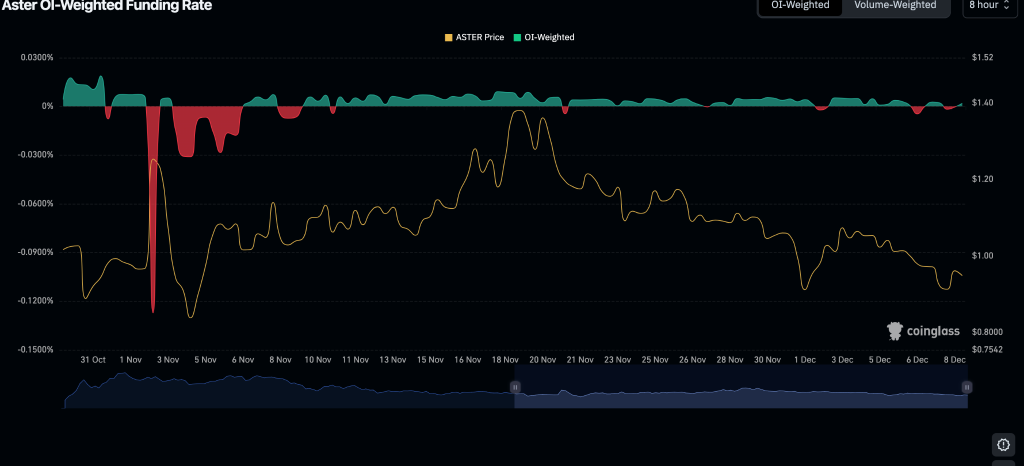
According to data from Coinglass, the OI-weighted funding rate has stayed predominantly neutral to positive, even as the price has experienced a decline. This suggests that a majority of traders are maintaining long positions rather than anticipating further downward movement. There have been occasional short spikes in negative funding, such as those observed in early November. However, these periods were brief, with funding quickly returning to neutral levels shortly thereafter. This pattern indicates that bearish sentiment has not fully permeated the futures trading community.
Technical Indicators Signal Continued Weakness
The Relative Strength Index (RSI) for a 14-day period is currently at 40.13, which is below the neutral midpoint of 50. This reading indicates that the asset is experiencing downward pressure, although it has not yet entered oversold territory. The trend of the RSI remains downward, aligning with the current price action.
The Moving Average Convergence Divergence (MACD) also presents a weak setup. The MACD line is positioned below the signal line, and both indicators are in negative territory. Red histogram bars continue to appear, though their spacing is becoming narrower. This suggests that selling pressure is ongoing but may be starting to decelerate.
Fragile Conditions Persist as Support is Retested
The broader market sentiment remains subdued. Widespread price pressure within the cryptocurrency market may be impacting ASTER, even as it attempts to maintain its position above a critical support level. Traders are exhibiting caution. One market observer noted, "If the market stays soft, this level could fail."
Currently, there are no clear signals confirming a market reversal. Another trader commented, "We haven’t seen clear buying strength yet." Many participants are waiting for definitive confirmation before making further investment decisions.
ASTER is at a significant decision point. The price action observed around the $0.95 level is likely to dictate its immediate future trajectory.