

Summary of Key Developments
- •Aster is trading near $0.98, recovering from a dip to the $0.92 level.
- •The project initiated its Stage 4 buyback program eight days ahead of schedule to provide support during market volatility.
- •Technical indicators, including RSI, Stochastic, and CCI, are showing positive momentum and an upward trend.
Current Market Performance and Trading Activity
At the time of reporting, Aster was priced at $0.984, reflecting a 1.8% decrease over the day. The token's weekly trading range has been between $0.9007 and $1.18. Over the past week, the price has declined by approximately 15%, and it remains about 59% below its all-time high of $2.41, which was recorded on September 24.
Trading volume saw a significant increase, rising by 62% to $556 million. Data from CoinGlass indicates that Aster (ASTER) derivatives volume has climbed by 31% to $1.27 billion, with open interest experiencing a 3.6% rise. This combination of increased volume and open interest suggests that traders are increasing their exposure to Aster amidst a period of market fluctuation.
Initiation of Aster Stage 4 Buyback Program
Aster announced via an X post on December 2 that its Stage 4 buyback had been activated eight days earlier than originally planned. The team stated that this early launch was intended to "support holders during unstable market conditions" and that the program commenced immediately on-chain.
[Important Update] Stage 4 Buyback Now Live
As committed, Stage 4 buybacks began on December 2, 01:10 UTC.
Executing wallet address:
0x573ca9FF6b7f164dfF513077850d5CD796006fF4You can track buyback activity in real-time on-chain. All operations remain transparent and… https://t.co/BUrbDfDFK3
— Aster (@Aster_DEX) December 2, 2025
The operational structure of this stage is consistent with previous buyback phases. Protocol fees continue to fund the buybacks, with the potential for up to half of the purchased tokens to be allocated for burning, depending on trading volume. To date, Aster has completed the buyback of 155.72 million ASTER tokens across all previous stages, including 55.72 million during Stage 3 alone. A further 77.8 million tokens are slated for burning on December 5.
Members of the community have expressed positive sentiment regarding the early commencement of the buyback, with one holder noting that the action "proves the team is pushing real value, not empty promises."
During periods of high trading volume, the buyback mechanism has previously generated over $2 million daily. This process serves to reduce the circulating supply of tokens, simultaneously supporting liquidity incentives and future airdrop initiatives.
Aster Price Technical Analysis
Aster's price chart indicates a notable shift following a challenging period at the end of November. A significant price decline led the token towards the $0.92–$0.94 area, where substantial buying interest emerged, accompanied by increased trading volume. The price then broke above a short-term descending trendline on December 1 and has maintained a gradual upward trajectory since.
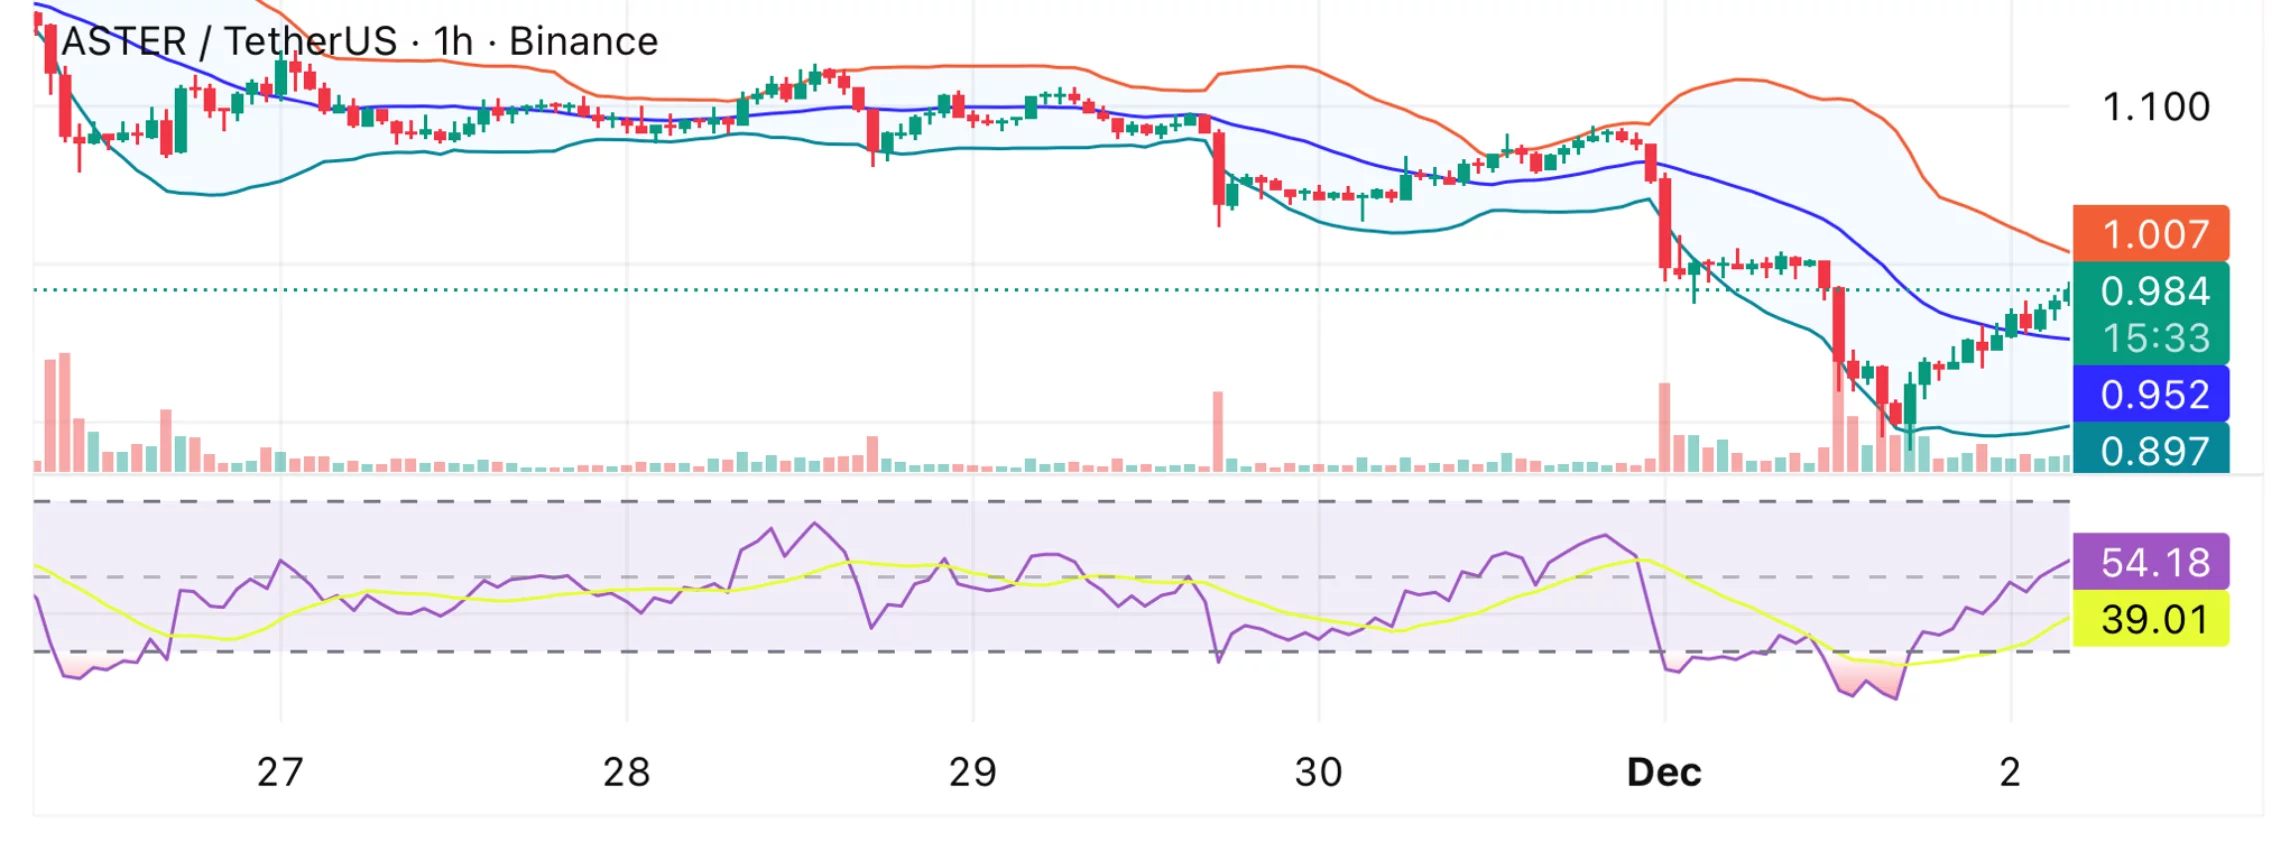
Early indicators of a potential recovery are evident in the momentum oscillators. The Relative Strength Index (RSI) has formed a clear bullish divergence. This pattern, where the price makes a lower low while the RSI registers a higher low, is often interpreted as a signal of an impending bullish trend reversal.
The Stochastic RSI and the Commodity Channel Index (CCI) have also turned upward from oversold levels, suggesting strengthening short-term momentum. While the MACD's lines are converging, the indicator remains in negative territory, and the Average Directional Index (ADX) is hovering near 20. This suggests that the trend is still in its development phase rather than being fully established.
A majority of the short-term moving averages, including the 10-period and 20-period moving averages, are currently positioned above the current price, despite recent gains. This indicates that $1.00 remains a critical resistance level for buyers to overcome.
A decisive daily close above the $1.00 mark would signify the first successful reclamation of local resistance and could pave the way for a move towards the $1.06–$1.14 zone, where previous price support levels are located. A sustained push through this range would complete the anticipated rebound pattern that began on December 1.
Conversely, a failure to hold above $0.95 could reintroduce downside pressure, potentially leading to a retest of the $0.92 level and possibly the $0.88–$0.90 zone if broader market sentiment deteriorates.