

AVAX Price Breaks Support at $16, What Next?
Avalanche (AVAX) price has retested the same support band that has held the market together since March, and the pressure around this level is unmistakably heavier than before. A top analyst on X (formerly Twitter) indicated that this level represents a high demand zone among smart money investors, suggesting that entering the market at this point introduces a balanced risk-to-reward ratio.
As shared by @ali_charts on X, the $16 zone has acted as a reliable floor for nearly eight months, with each touch of this level historically sparking a meaningful rebound. However, this time, AVAX price has broken this key support level, and in a significantly different market backdrop. The market momentum is fading, price structure is weakening, and the overall cryptocurrency markets are trending towards exhaustion.
On the daily chart, AVAX was hovering directly above the 50-day Exponential Moving Average (EMA), a moving average that has served as a primary trend guide for most of the year. Historically, any decisive move below this EMA on major timeframes has triggered a deeper and more sustained selloff. Losing the 50-EMA this time not only broke the March support but also aligned with a pattern of weakening higher-timeframe trend stability. Under such conditions, a price decline tends to accelerate rather than just continue.

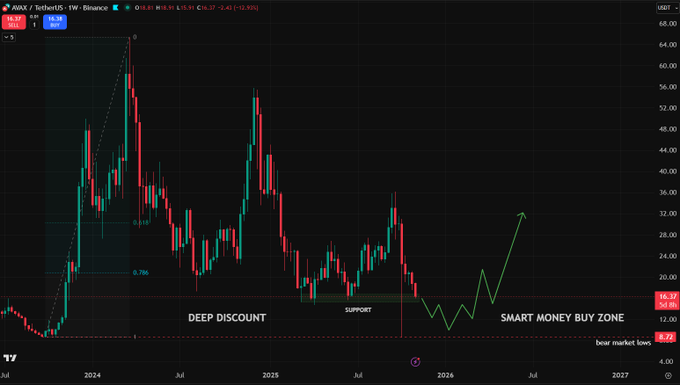
The weekly chart provides an even clearer perspective on the larger picture. AVAX is trading within what Carl Moon described as a "deep discount zone," a setup he pointed out two days prior. The current market structure suggests that if this floor collapses, the price could slide into the "smart money buy zone" situated lower, where long-term players typically accumulate assets after periods of capitulation. This region closely aligns with the bear market lows, and the chart's symmetry implies that the market may need to revisit these depths before forming a true macro bottom.
Despite these bearish signals, not all analysts view the current situation as a threat. REKTbuildr suggested that the pattern resembles a potential bottoming structure. AVAX has indeed demonstrated this behavior in the past, with violent wicks into support followed by sharp recoveries. However, the current difference lies in the growing confluence of weakening indicators, declining momentum, and repeated failures to establish higher highs. When price repeatedly returns to the same support level with increasing force, it typically signifies thinning demand. If Avalanche loses the 50-EMA and the $16 support that has anchored the market since March, the subsequent price decline is unlikely to be gentle. The charts indicate that the real selloff begins below this line, not above it. Unless bulls can quickly regain strength, AVAX price may be preparing for the kind of deeper flush that historically precedes major long-term accumulation phases.
Derivatives Data Suggests Futures Traders Are Bracing
According to data from Coinglass, the derivatives market for Avalanche (AVAX) is cooling sharply, and the statistics indicate a market losing momentum rather than preparing for an immediate rebound. Trading volume has dropped by more than 50%, a significant contraction that often signals fading speculative interest. Simultaneously, open interest has seen a slight decline. This combination typically suggests that traders are closing existing positions rather than opening new ones.
When both volume and open interest fall together, it reflects a market stepping away from risk. However, the long/short metrics present a different narrative, as traders across various exchanges are leaning heavily towards long positions. The 24-hour long/short ratio remains above 1.0, with exchanges like Binance and OKX showing even more aggressive positioning, with long ratios extending well beyond 2.0 in several categories. This indicates that top traders are clearly positioning for an upside move.
In a declining-volume environment, such confidence can become a liability. When conviction rises as liquidity thins, markets often become vulnerable to sharp squeezes. Liquidation data further reinforces the building pressure. Over the past 12 hours, nearly $418,000 in positions have been liquidated, with the majority coming from short traders. However, the 24-hour view reveals the opposite: more than $600,000 in long liquidations have occurred, which is three times higher than short liquidations. This suggests that bulls are beginning to lose their footing as the price attempts to stabilize.