
Bitcoin is pushing into a critical zone after a sharp upside move that has lifted price back toward recent highs.
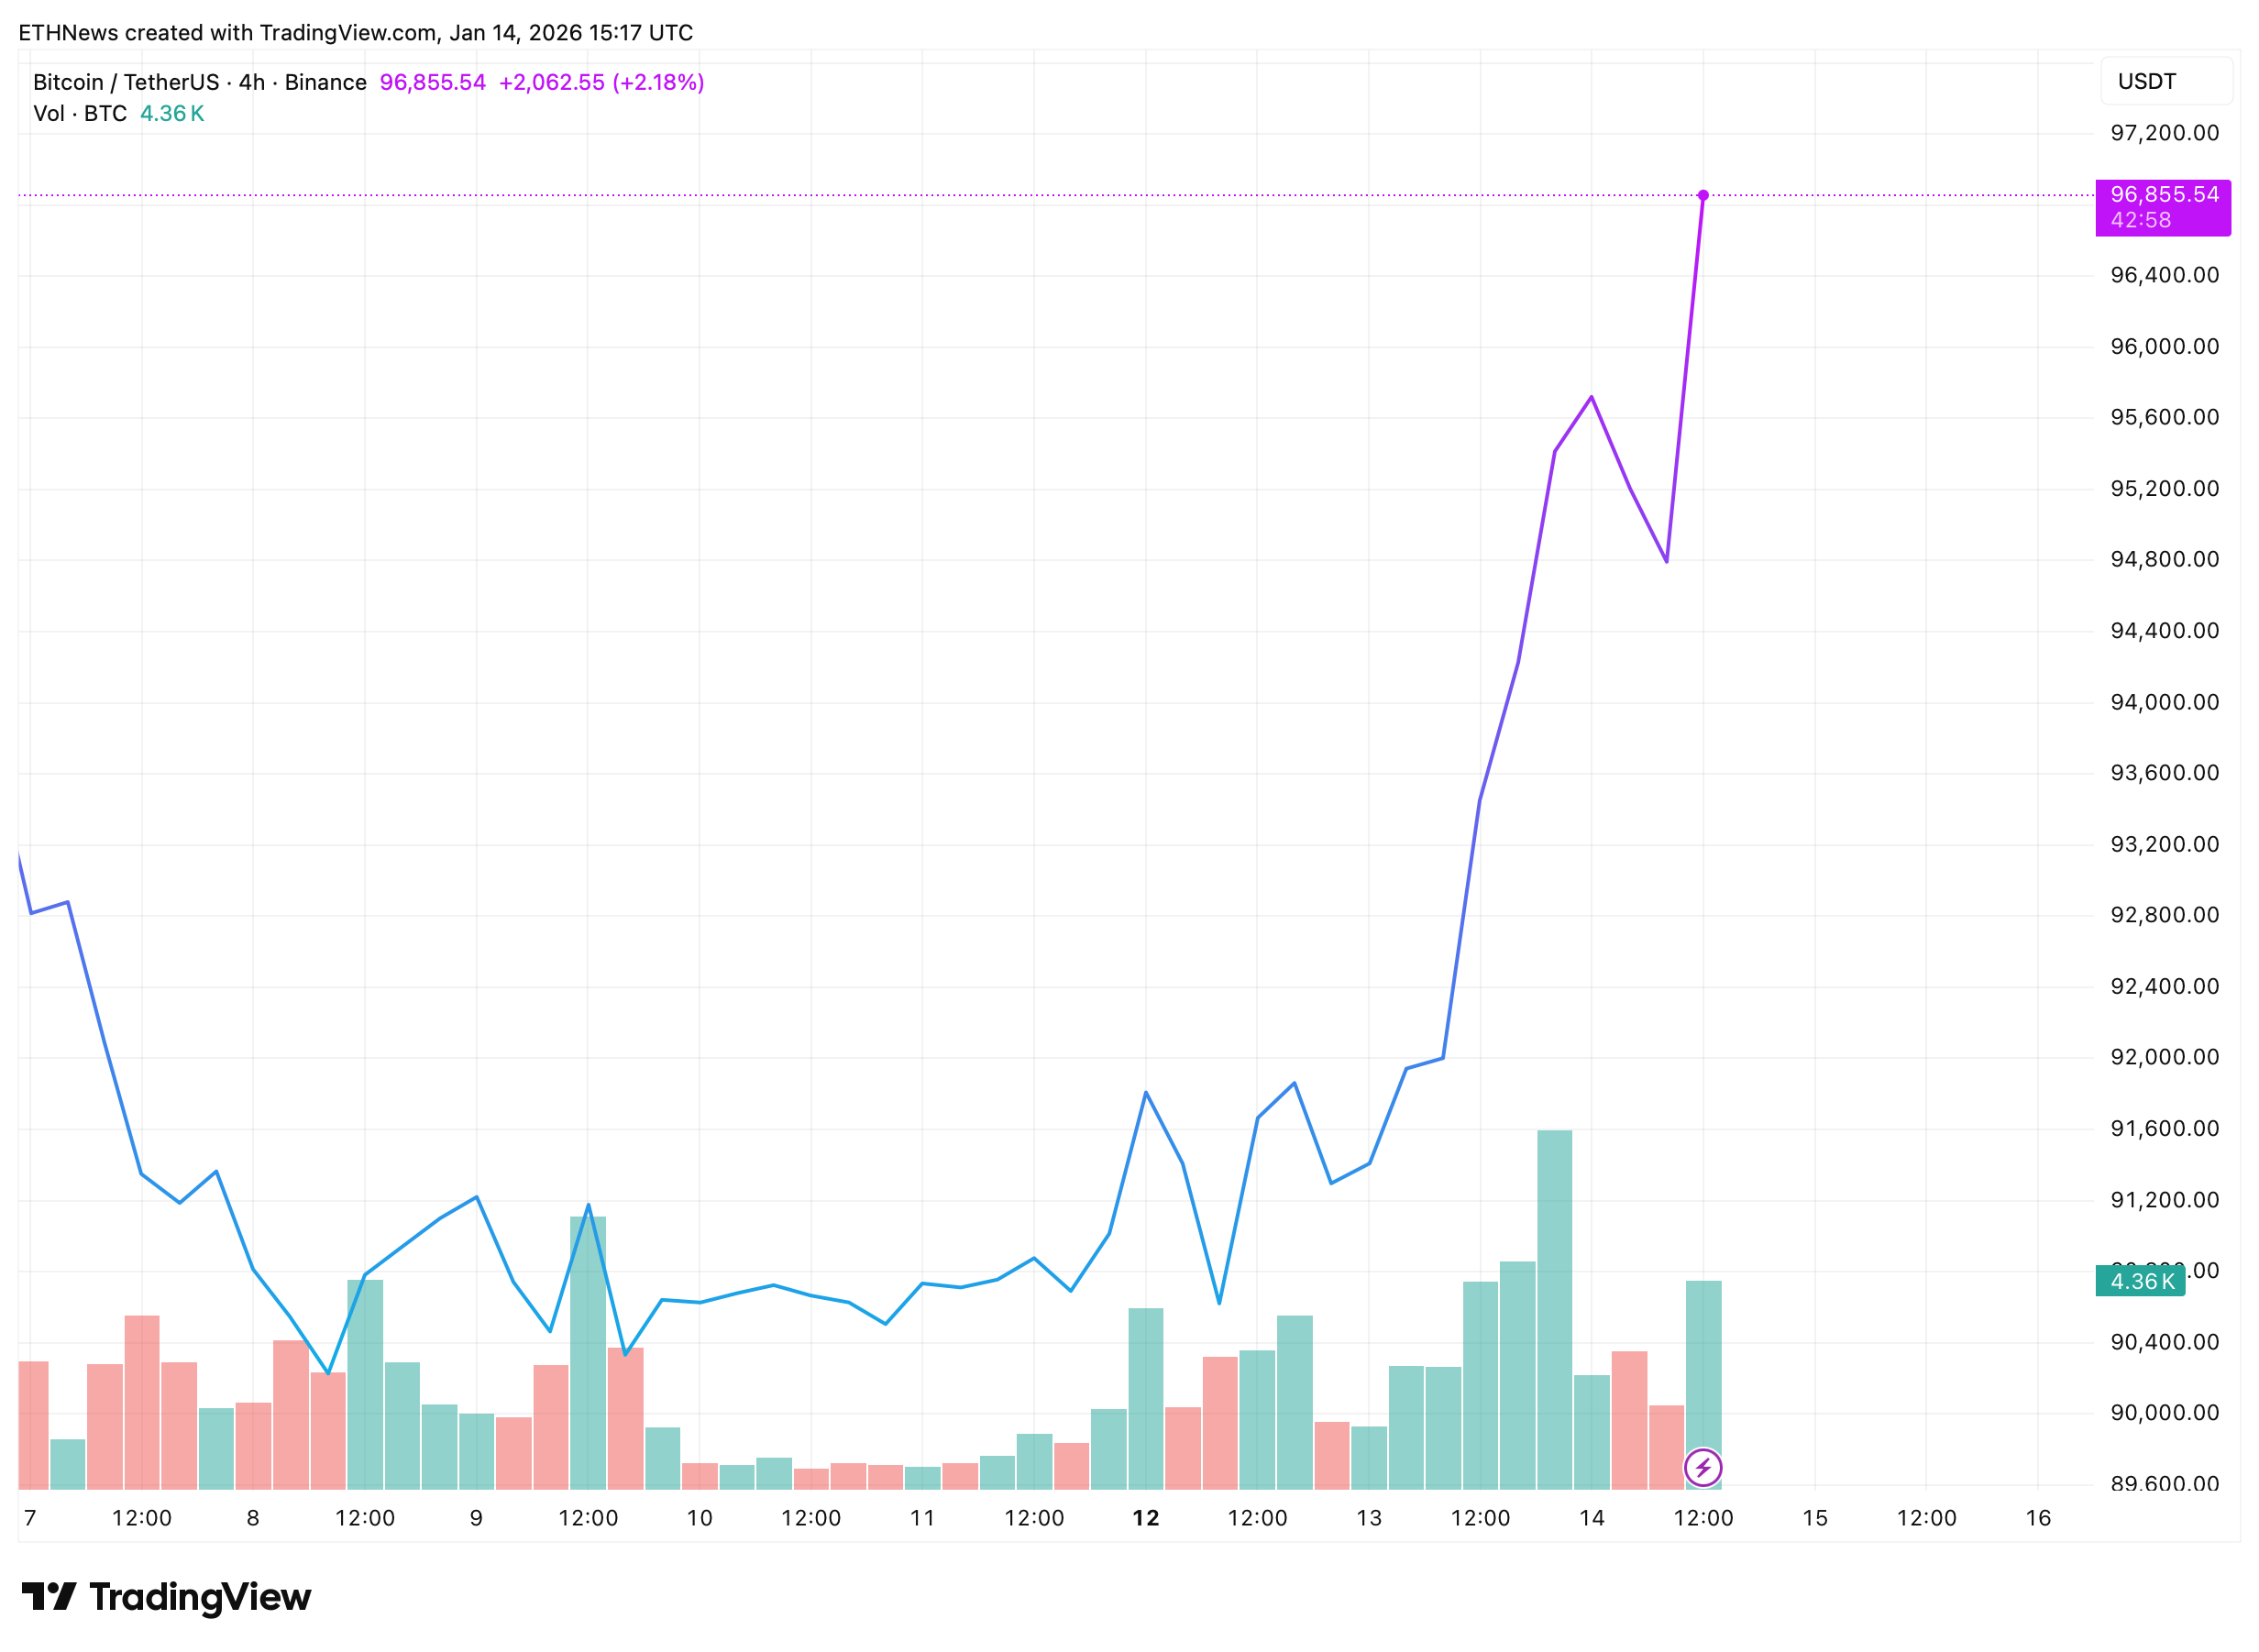
On Binance, BTC/USDT was trading around $96,850 at the time of writing, up more than 3% for the day. The advance places price near the upper end of its recent range, following a rapid recovery from earlier consolidation.
The move unfolded quickly. After spending several sessions fluctuating below $92,000, Bitcoin accelerated higher, slicing through intermediate levels with limited hesitation. A brief pullback toward the mid-$94,000 area followed, but buyers stepped back in, pushing price straight into the $96,800 region.
Current Price Action Shows Aggressive Reclaim of Higher Levels
The latest four-hour chart reflects a decisive shift in momentum. Bitcoin moved from a tight, uneven base around $90,500–$91,500 into a near-vertical advance, carrying price through $93,000 and $95,000 in quick succession. Volume expanded during the push, standing out relative to the quieter sessions earlier in the week.
After topping near $96,900, price briefly dipped toward $94,800 before rebounding sharply. That recovery returned BTC to the highs rather than back into the prior range, leaving price pinned close to resistance instead of drifting lower. The structure now shows higher lows on short pullbacks, with price holding elevated rather than resetting.
Gain Muse Flags Compression Beneath Long-Term Resistance
A broader technical view shared by crypto trader Gain Muse focuses on Bitcoin pressing against a long-term descending resistance line. The analysis highlights a controlled recovery from December lows, followed by a triangle formation that has already broken to the upside. Since that break, price has continued to ride a rising support line while compressing beneath overhead resistance.
In this framework, pullbacks remain shallow and orderly, with price repeatedly respecting the ascending base. The chart shows Bitcoin advancing in measured steps rather than a single extension, building structure as it approaches the upper boundary. A defined target zone sits above the current range, illustrated as the next area of interest if price continues to hold above support.
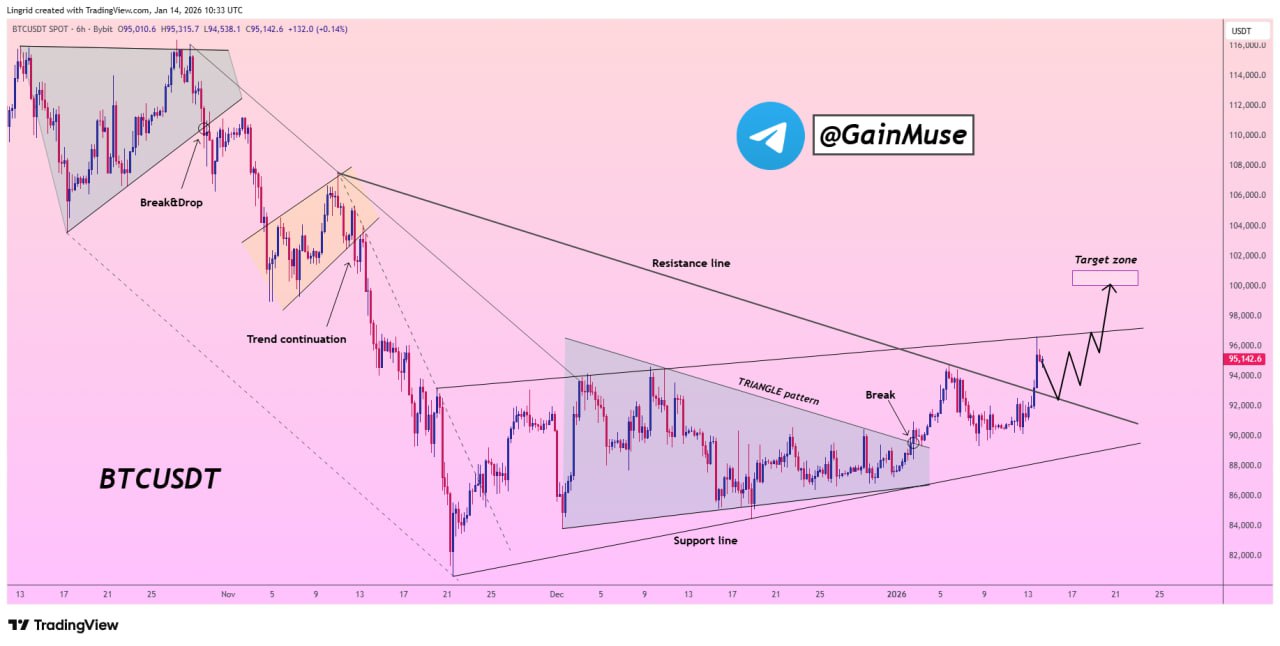
The Gain Muse view frames the current area as a pressure point rather than a reversal zone. Price is still capped by resistance, but the compression against it reflects sustained demand rather than rejection.
Together, the live price chart and the broader structural view show Bitcoin trading with momentum firmly intact. Price is holding near highs, volatility has shifted upward, and the market is testing whether the latest advance can translate into a sustained break beyond the upper boundary.