

Bitcoin’s latest weekly close has shifted one of the strongest trend signals of the cycle, and according to the new report shared by Doctor Profit, the market may be entering a phase that traders have not seen since early 2024.
While social media debates whether the new death cross is bullish or bearish, Dr Profit argues that most traders are comparing the wrong data points and ignoring the only level that has mattered for nearly two years: the weekly EMA50, the so-called golden line.
Why the EMA50 Breakdown Matters More Than the Death Cross Itself
For the entire 2024–2025 cycle, Bitcoin respected the weekly EMA50 with near-perfect precision. Each time BTC touched this level, the market bounced, weekly candles closed above it, and the broader bullish structure continued.
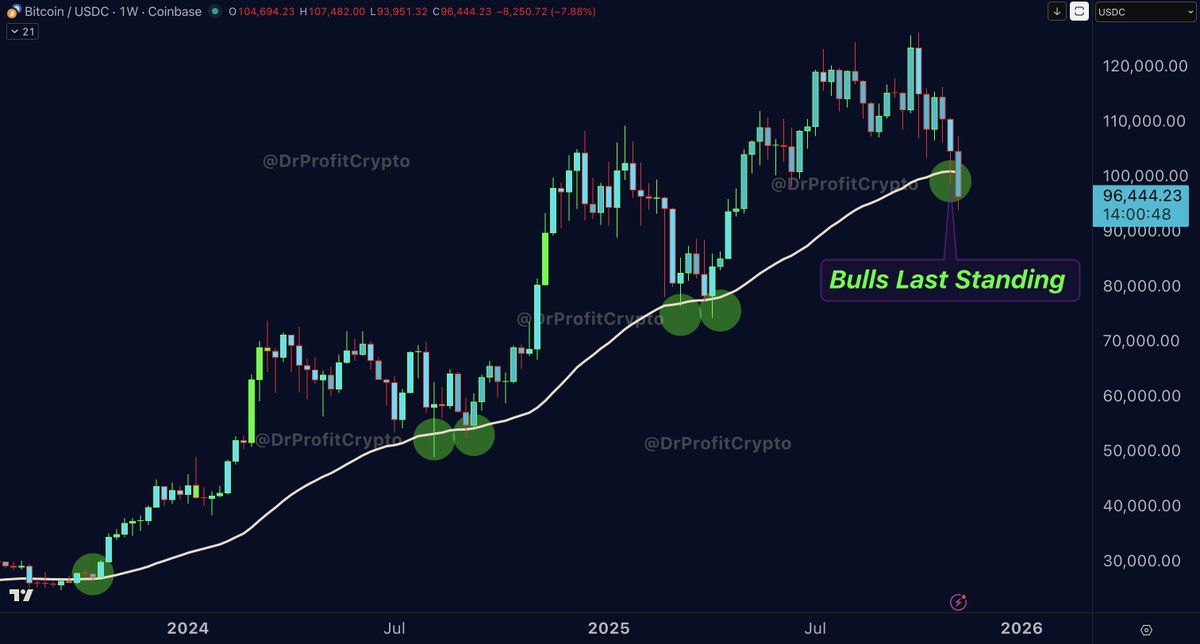
Dr Profit says this dynamic is what kept the bull market intact, not the moving average crossovers.
This week, however, the golden line finally broke. Bitcoin closed below the EMA50 for the first time since the bull market began.
This, he warns, changes everything.
Why Past “Bullish Death Crosses” Don’t Apply Now
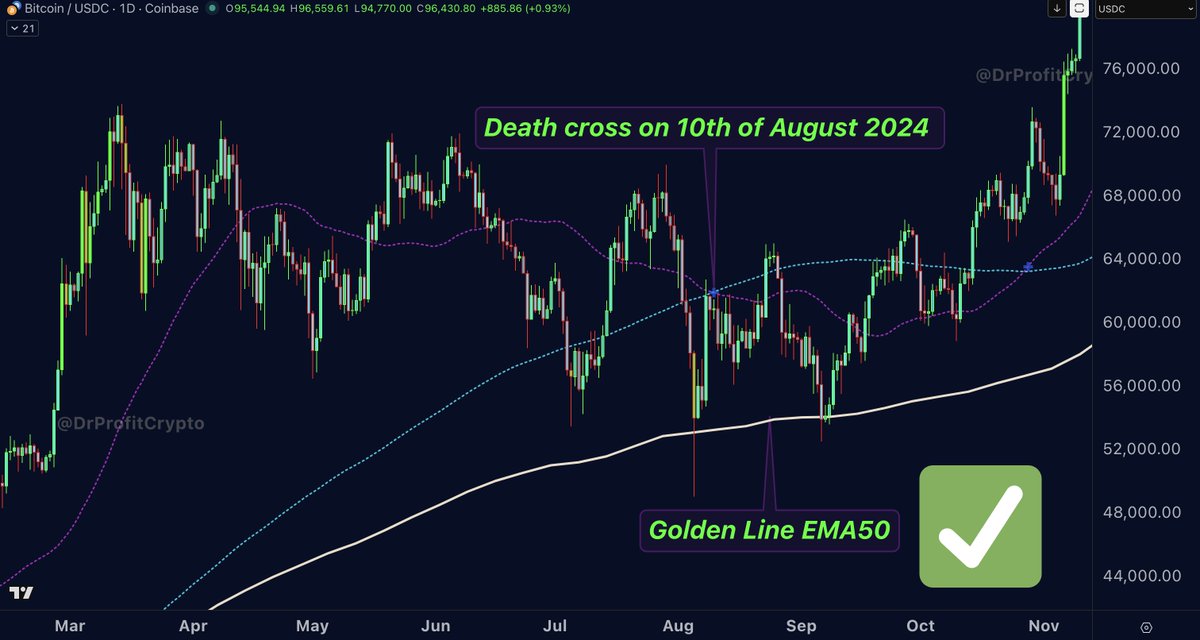
Traders pointing to previous death crosses – April 2025, August 2024, September 2023 – are missing the key detail:
- •2025 death cross: BTC was 12% above EMA50
- •2024 death cross: BTC was 17% above EMA50
- •2023 death cross: BTC was also above the EMA50
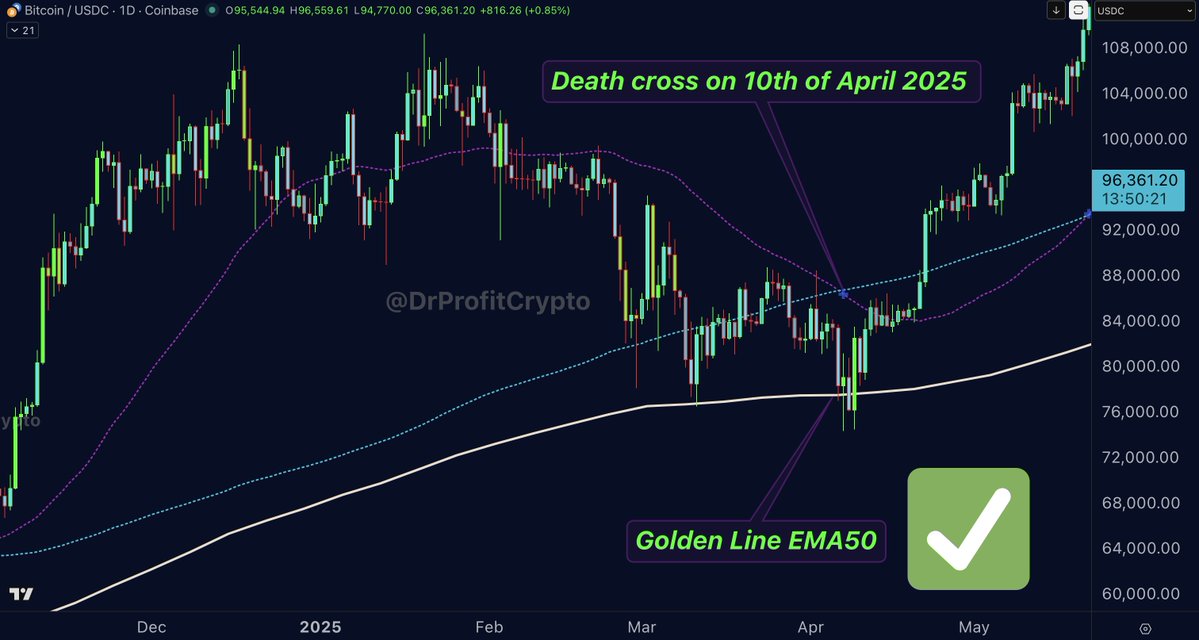
Each time, the chart structure confirmed the crossover was a fake bearish signal, because Bitcoin remained comfortably above the trend-defining line.
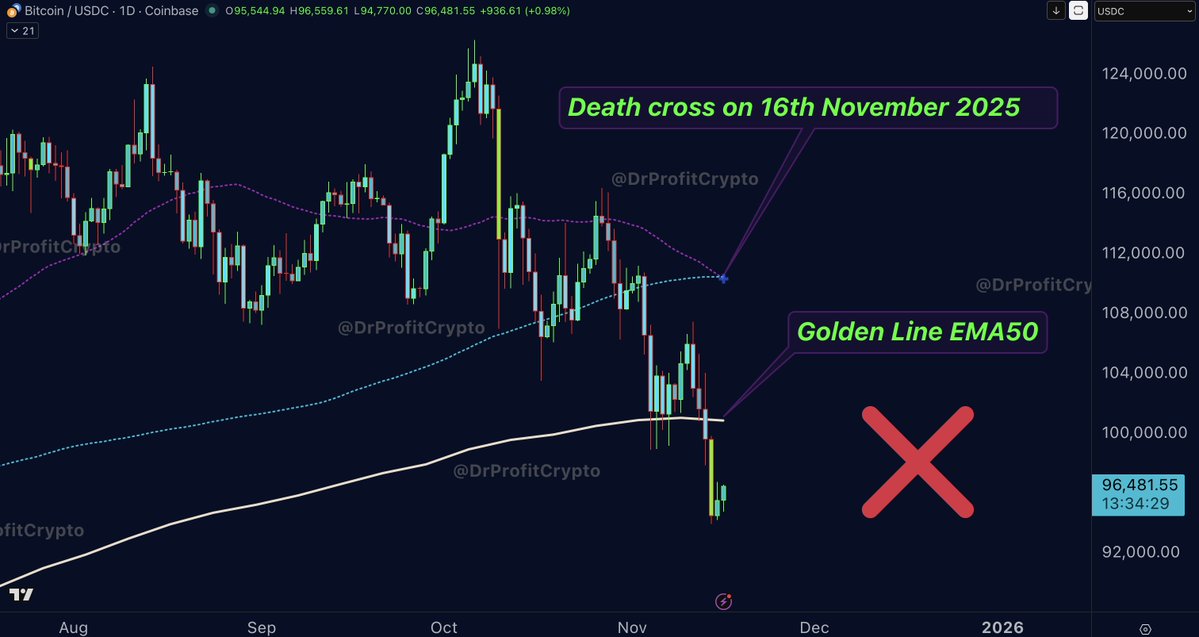
This time, the opposite is true:
- •Bitcoin is 6% below the EMA50
- •The weekly candle failed the golden line
- •The death cross happened under the trendline, not above it
Dr Profit calls this the first “true” death cross of the cycle, structurally bearish, not bullish.
Why Fear Index Signals Can Mislead Traders
Extreme fear usually marks major bottoms in bull markets. But in the early stages of a bear market, fear is not a bottom signal; it’s a starting signal.
Dr Profit highlights the 2021 example:
- •Fear & Greed Index dropped to 16 at $50K
- •Bitcoin still fell to $16K–$18K in the months that followed
Today’s fear level near 10 does not guarantee that capitulation is complete.
Whales and ETFs Are Confirming The Shift
In previous corrections of 2024–2025:
- •ETFs sold,
- •Whales accumulated, providing a floor.
But this time:
- •ETFs are selling, and
- •Whale net volume is also negative
This double-sided pressure has not appeared once during the last two years of corrections. It also coincides with a dangerous price cluster:
- •The average BTC bought in the last six months is around $94,600
- •Returning to that level could trigger a wave of forced breakeven selling
Short-term traders historically dump at break-even, meaning liquidity near $94K–$95K may turn into resistance instead of a recovery zone.
Macro Risks Intensify the Setup
Beyond charts, Dr Profit reiterates his September warning regarding growing stress in the REPO market, a macro factor that has historically preceded liquidity shocks. According to him, the pressure visible today is only the beginning.
Dr Profit’s Position
His stance remains unchanged:
- •100% in USDT
- •Short positions around $119K
- •Waiting rather than over-trading
The conclusion is simple:
Bitcoin’s break below the weekly EMA50, combined with a death cross occurring under the trendline and simultaneous ETF + whale selling, paints a structurally bearish picture unlike the previous three death crosses.
The next move, he says, will be shaped by patience, not optimism.