
Current Market Position and Technical Outlook
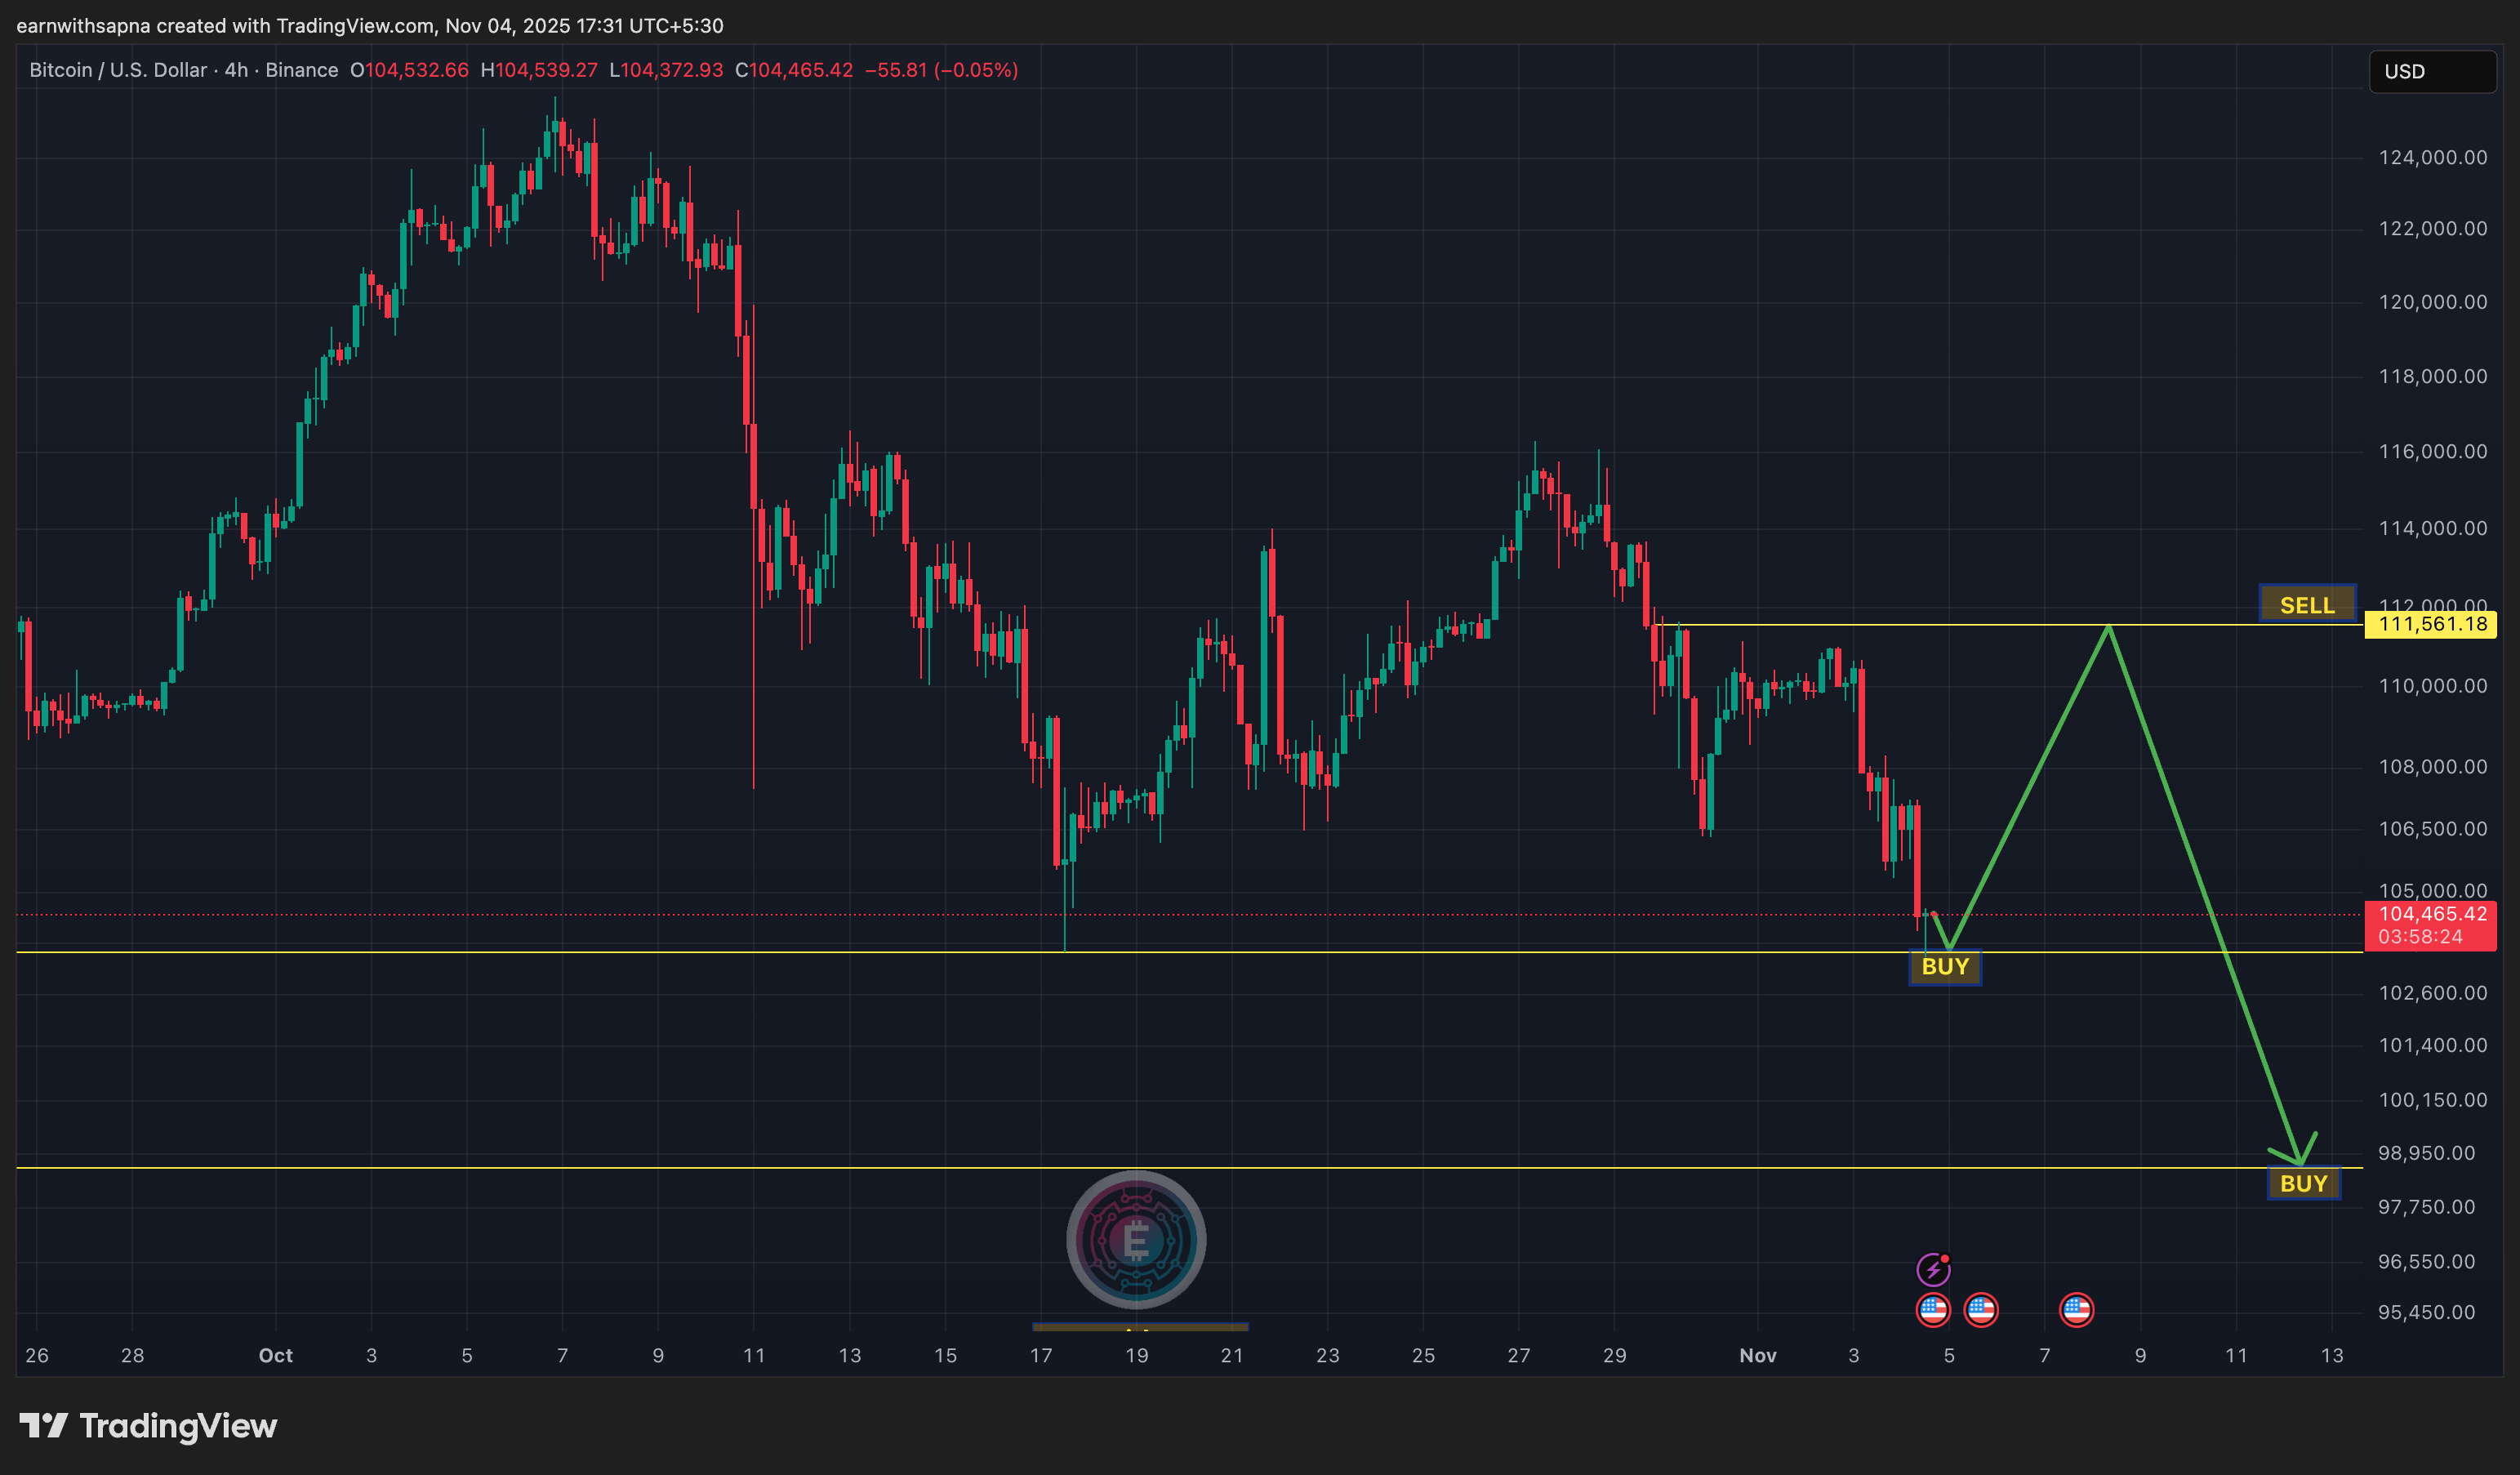
Bitcoin is currently trading near a strong support zone, specifically between $104,000 and $102,500. This particular price range has historically served as a significant accumulation area for the cryptocurrency.
From a technical standpoint, Bitcoin appears to be in the process of completing the final segment of a correction phase. This suggests a potential for a bounce from the current support region, with an anticipated upward movement towards the upper resistance levels.
Trading Strategy and Target Levels
A long position has been initiated from the current trading levels, approximately $104,453, with the expectation of a short-term recovery in price.
The identified target zone for this trade is situated near the next significant resistance area, which is around the $112,000 mark. At this level, the plan is to secure partial or full profit and then conduct a re-analysis of the market structure to determine the optimal strategy for the subsequent price movement.
Chart Pattern and Potential Reversal Signals
Observing the 4-hour chart, Bitcoin seems to be forming the micro wave 5 of the main corrective wave C. This specific wave pattern is often indicative of the conclusion of a downtrend phase.
Should the price successfully maintain its position above the Potential Reversal Zone (PRZ), a strong reversal in the market could materialize in the upcoming trading sessions.
Risk Management and Invalidating Factors
Risk Note: A critical level to monitor is $101,900. If Bitcoin experiences a strong momentum break below this price point, it would likely invalidate the current long setup. Such a break could signal a continuation of further downside movement, and it would be advisable to refrain from opening new long positions below this specified level.
This analysis represents an individual trading idea and should not be construed as financial advice.