

Recurring Weekly Divergence and Market Structure
Market analyst Cryptocium (@Cryptocium_id) has identified a bullish divergence on Bitcoin’s weekly timeframe. The setup shows higher lows on the oscillator while price forms slightly lower lows, suggesting waning bearish momentum. Historically, such patterns have aligned with major reversal points across multiple market cycles.
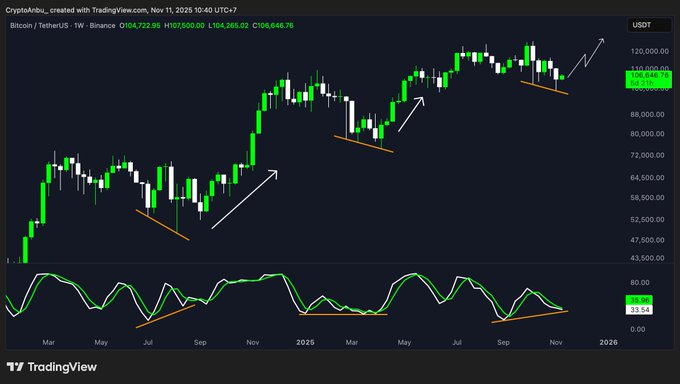
Similar weekly divergences were followed by long rallies in 2024 and early 2025. All the events signified an end of a rectifying period, and then a sudden upward jump. The present alignment now replicates that same structure, prompting attention from traders watching for confirmation of another bottom.
Bitcoin is technically in a downward channel of the past corrective structures which provide launch pads to the further uptrends. Continued consolidation has ensured market equilibrium whereby the zone of $96,000-$104,000 represents soft support and accumulation.
Key Levels and Momentum Behavior
The current trend of Bitcoin above the $100,000 level shows that there is a balance between a profit-taking and a new accumulation. Momentum indicators have stabilized at the support zone of between 96K and 104K and still maintain the bigger bullish pattern. This base formation mirrors prior setups where price rested before advancing.
The weekly chart trend indicates that the potential targets of Bitcoin should be the $115,000-$120,000 level in case of the definite breakout. Past divergences have occurred in the same pattern, whereby increasing momentum readings and increasing slope of the oscillator curve occur after the oversold ranges. Traders continue monitoring whether this recovery pattern will validate.
Momentum indicators on the lower panel show upward curvature after deep oversold conditions, consistent with early recovery phases from prior cycles. The alignment between rising oscillator trends and steady price consolidation reinforces the signal that buying interest is gradually strengthening.
Sentiment, Trading Data, and Market Positioning
Data shows Bitcoin at a range of between $98,000-$107,000 between November 5 and 11, 2025, and recent gains have pushed the price to approximately 105,018. The shift of the red zone to green on the charts is a sign of new purchasing and a possible short covering.
The results of performance indicators are not fully positive: 4-hour, 24-hour, and 7-days changes are still slightly negative, and year-to-date and 1-year returns are positive. The YTD of +12.40% and 1-year performance of +30.49 indicate that the macro trend is positive, although it begins to stagnate in the near future.
Long/short ratios across major exchanges display a clear bullish skew. On Binance, the long/short ratio (accounts) stands at 1.963, and the top trader ratio reaches 2.0329. OKX shows 1.92, underscoring that traders continue favoring long exposure. Liquidation data indicates more short positions were cleared as price rebounded, suggesting stronger bullish control in the short term.