

Bitcoin is heading toward its third consecutive week in the red, a stretch not seen since early autumn, as sentiment deteriorates and institutional outflows continue to grow. What began as a sharp pullback has now evolved into a full technical and macro-driven reversal.
October’s Euphoria Has Fully Unraveled
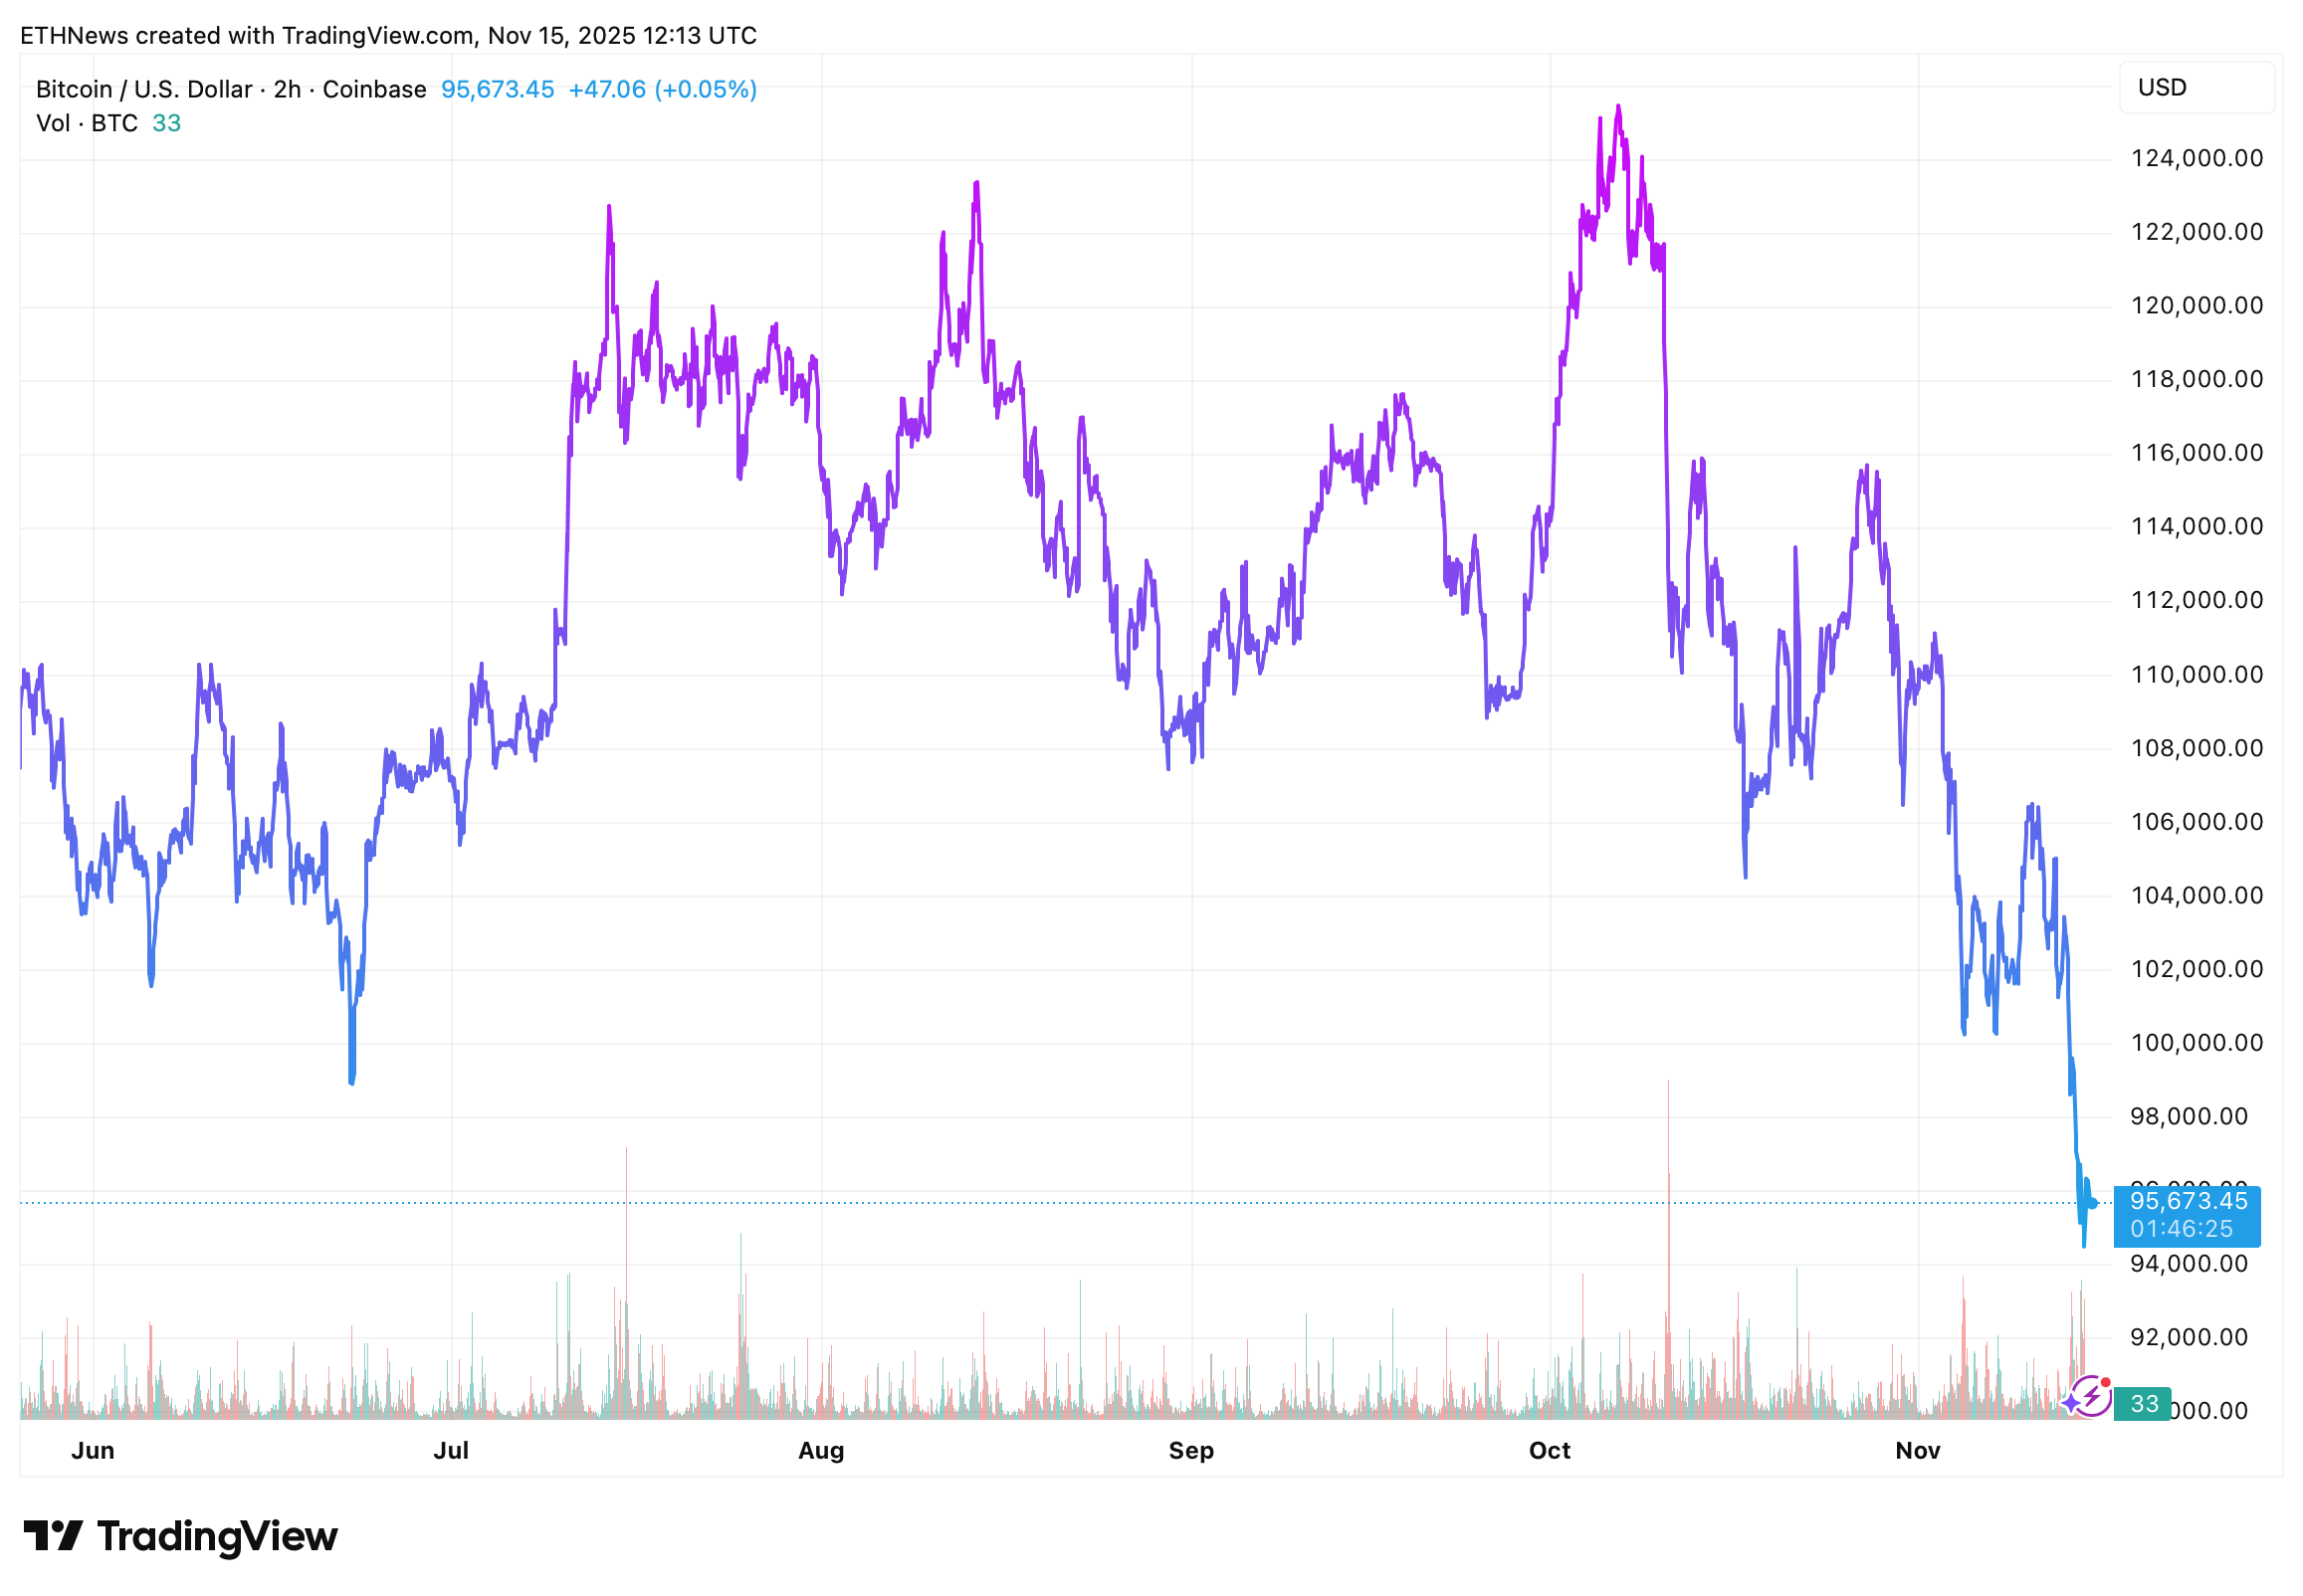
Just weeks ago, Bitcoin was celebrating a record-breaking surge to nearly $126,500, capping one of its strongest rallies of the year. That excitement has since vanished. BTC has shed tens of thousands of dollars, and the weekly chart now shows three consecutive large red candles, a formation known as “three black crows,” often signaling powerful bearish momentum.
Technical patterns also reinforce the downside risks. Bitcoin has broken down from a rising wedge, a classic reversal structure that historically leads to accelerated selling once support fails. Based on the wedge’s width, the technical target sits near mid $62,000s, implying that the correction could extend toward a 35% decline from current levels.
Momentum indicators flashed warnings ahead of time. Both RSI and MACD peaked before price topped out, a bearish divergence that often precedes deeper corrections.
Macro Pressure Builds as Rate-Cut Hopes Fade
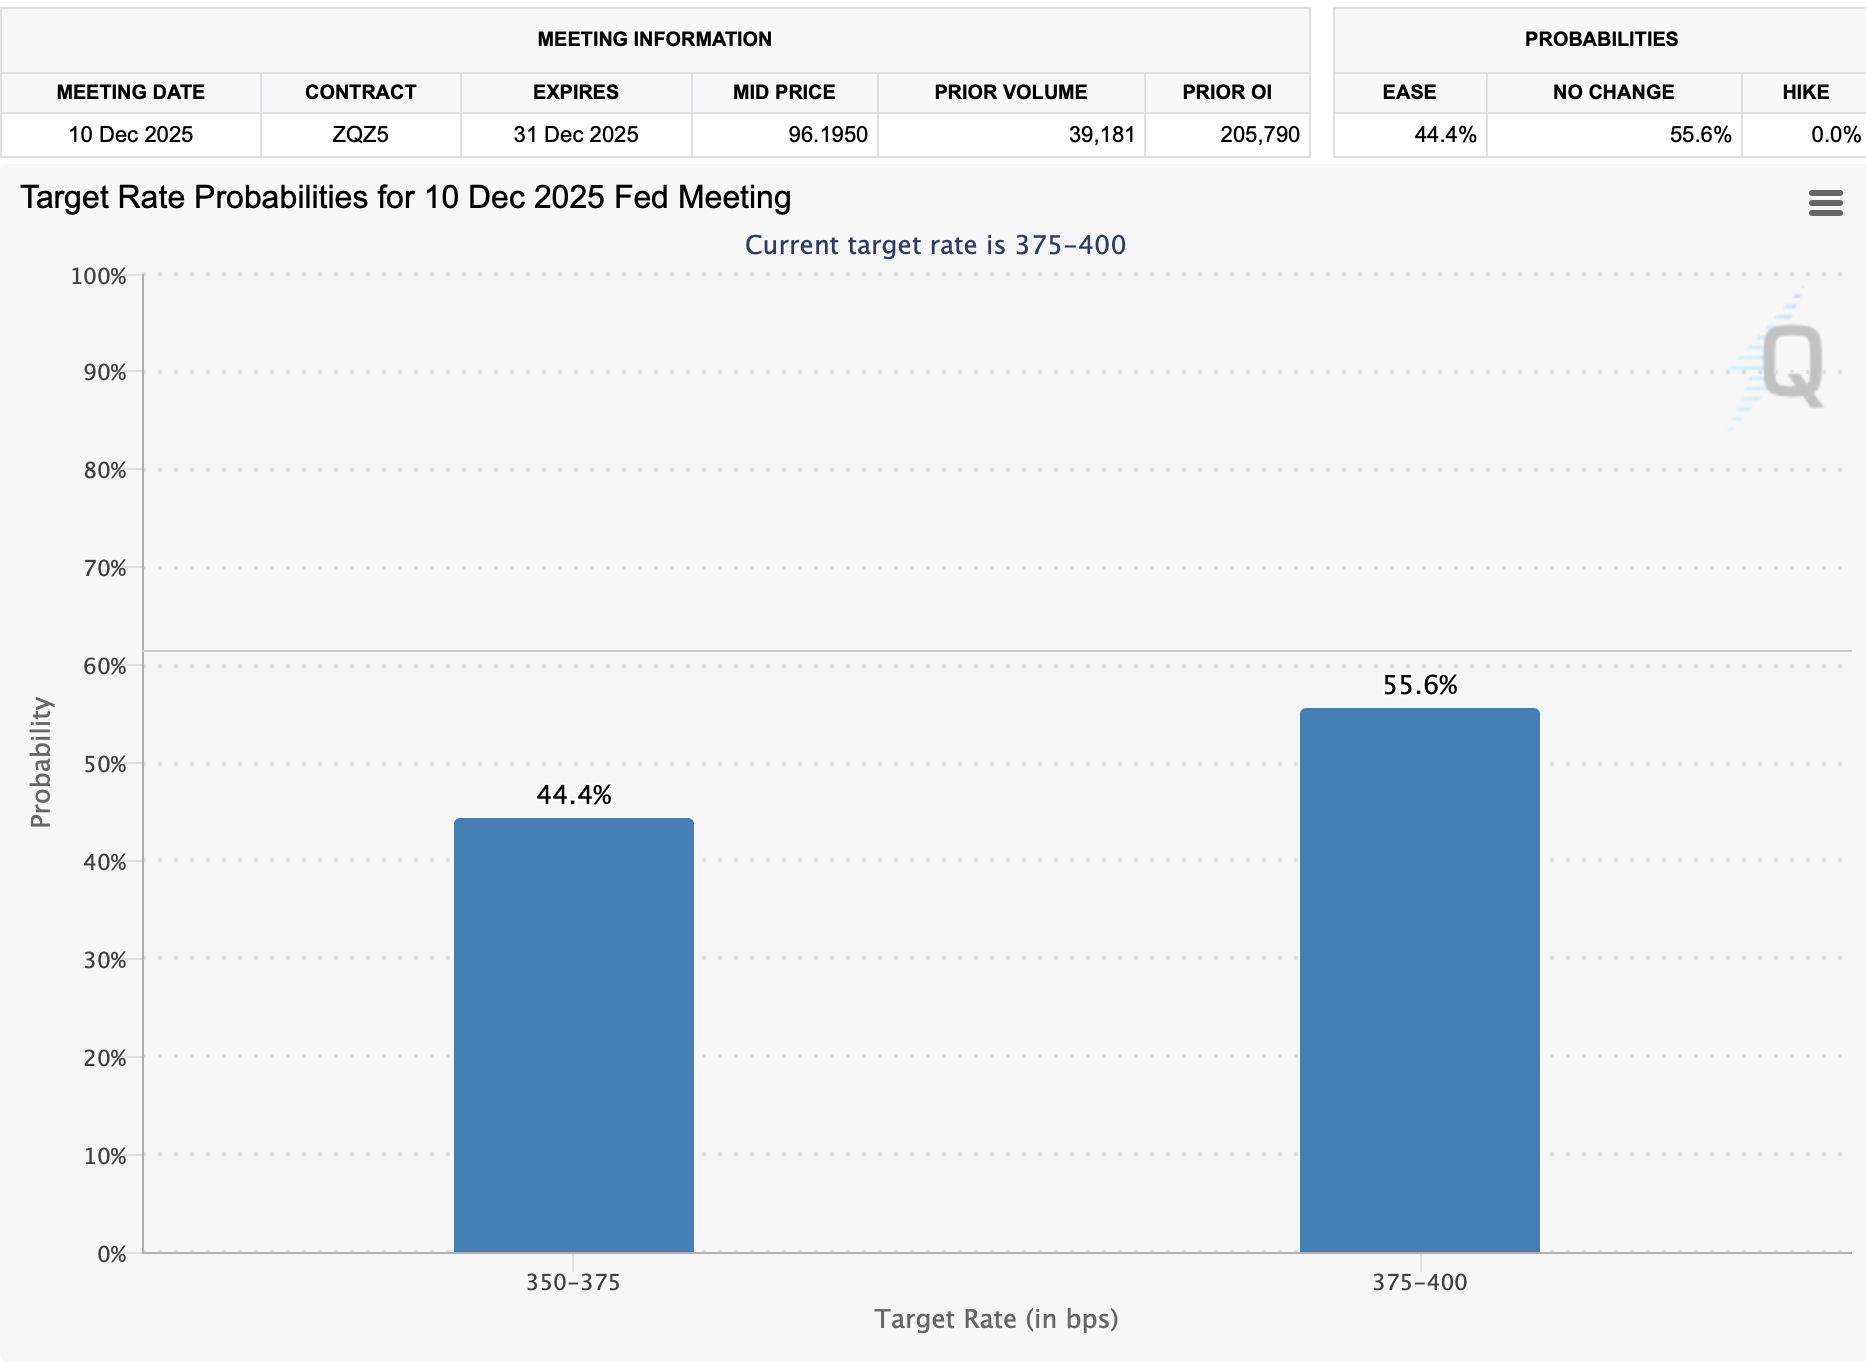
The Federal Reserve’s shifting outlook has added fuel to the downturn. Expectations for a December rate cut have collapsed from 90% in late October to around 55%, according to Polymarket data. Sticky inflation and hawkish commentary from Fed officials are pushing traders out of risk assets, with crypto feeling the impact most acutely.
This macro shift is visible in derivatives markets: Bitcoin futures open interest has plunged from nearly $100 billion to about $60 billion, signaling a massive liquidation-driven reset in leverage. Spot Bitcoin ETFs have also suffered persistent outflows, highlighting waning institutional demand.
What Would Invalidate the Bearish Outlook?
For now, bears remain firmly in control. Analysts note that Bitcoin would need to reclaim the $110,000 zone to signal exhaustion in the downtrend. Only then would a potential retest of the $126,330 all-time high return to the narrative.
Until that recovery happens, the path toward the mid-$60,000 range, the technical target derived from the wedge breakdown, remains a realistic scenario as risk aversion continues to dictate market behavior.