
Key Insights
- •Bitcoin is testing the $94K resistance level, with $93.5K and $90.5K identified as potential zones for aggressive and defensive long positions, respectively.
- •A decisive breakout above $95.6K could propel the price towards $99K and potentially reach the $100K mark.
- •Funding rates have turned negative, indicating an increase in short-selling pressure which could fuel a short squeeze.
Bitcoin has surged to $94,250, reaching a critical resistance zone that traders have been closely monitoring. This level, around $94,000, has historically acted as a significant barrier and is currently being tested once again. The cryptocurrency experienced a notable increase of over 4% in the past 24 hours, demonstrating considerable strength in anticipation of the upcoming Federal Reserve policy meeting.
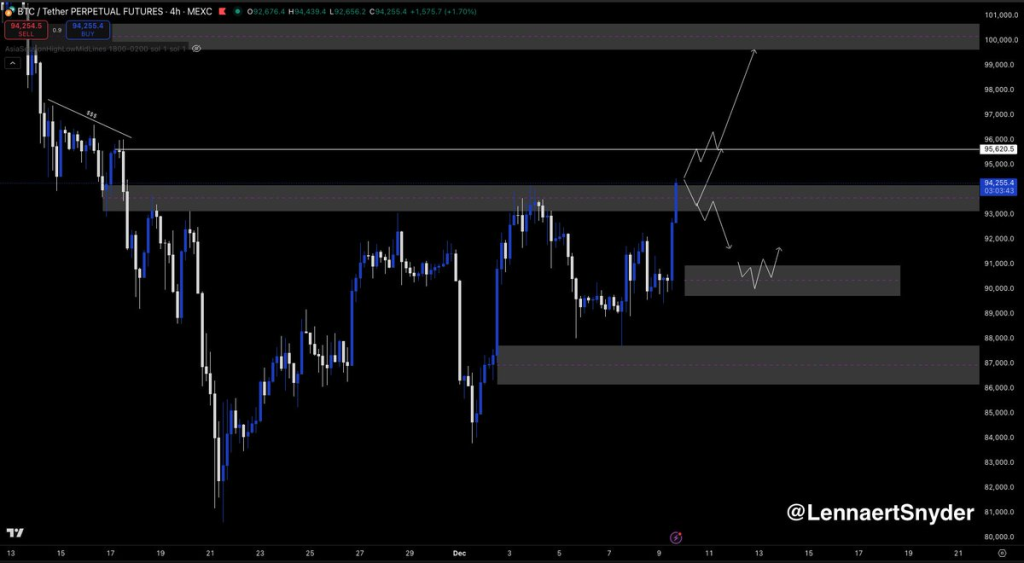
Analyst Lennaert Snyder observed that "Bitcoin just pumped right into key ~$94,000 resistance," and suggested that a compression breakout was anticipated. He further elaborated that if Bitcoin manages to sustain its price above this level, the chart would indicate a higher low structure, serving as an early signal for potential long positions. Snyder identified $93,500 as the initial aggressive long area, contingent on signs of strength on lower timeframes. For a more conservative long entry, he recommended waiting for the price to approach $90,500, which represents the base of the last significant upward movement.
$95.6K and $99K Mark Next Critical Zones
Should the upward momentum continue, the next significant price barriers for Bitcoin are $95,600 and $99,000. These levels have previously presented strong resistance. Snyder explained that a successful breach above $95,600 could pave the way for a rally aiming for the $100,000 level. He cautioned that "If we reject ~$95,600, scalp-shorts after the failure are valid."
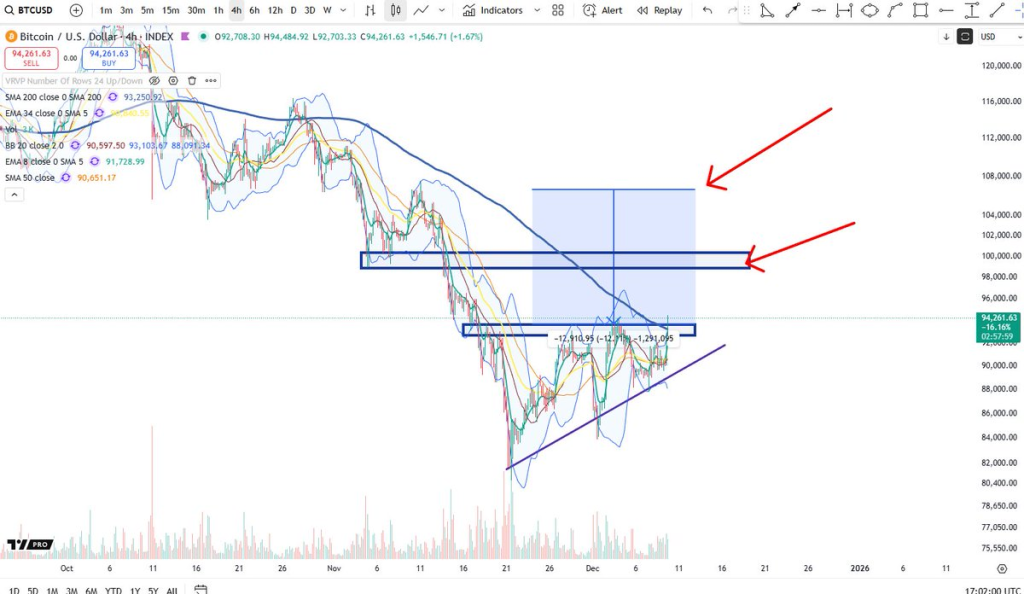
Another market analyst, Big Cheds, shared a chart illustrating an ascending triangle pattern on the 4-hour timeframe. This pattern, characterized by higher lows under a flat resistance line, is often a precursor to a price breakout.
Cheds commented, "Measured move to 106K, with major obstacles circa 99K."
If this bullish scenario materializes, it would represent the most substantial upward movement for Bitcoin in several months. Nevertheless, traders are likely to await a clear break and sustained hold above $95,000 before confirming this outcome.
CME Gap Filled at $89K
Earlier this week, Bitcoin Futures (CME: BTC1!) saw a price drop into the $89,400–$89,800 range, effectively closing a notable price gap. Such gaps are common occurrences in market movements and frequently act as support levels once filled.
Trading data indicates that the price experienced a bounce shortly after reaching this zone. A post from rektfencer noted, "$BTC tapped the CME gap already," referencing the price action that completed this move. With the CME gap now filled, one of the previously identified short-term bearish targets has been resolved.
Bitcoin price action after tapping the CME gap.
Short Squeeze Could Push Price Higher
Furthermore, funding rates have shifted significantly into negative territory, indicating that a larger number of traders are betting against Bitcoin despite its recent price appreciation. According to SuperBitcoinBro, this drop in funding rates is the lowest observed since June. When this phenomenon occurs during a price increase, it can create conditions for a short squeeze, forcing short-sellers to buy back their positions at a loss.
If a short squeeze does materialize, it could provide the necessary momentum to push Bitcoin beyond $95,600 and potentially test the upper resistance levels around $99,000 or $100,000. Until then, the price action observed at the current resistance levels will be crucial in determining whether the upward momentum persists or begins to fade.