

Bitcoin is trading near $95,000 after a volatile pullback that pushed price below several long-tracked support references.
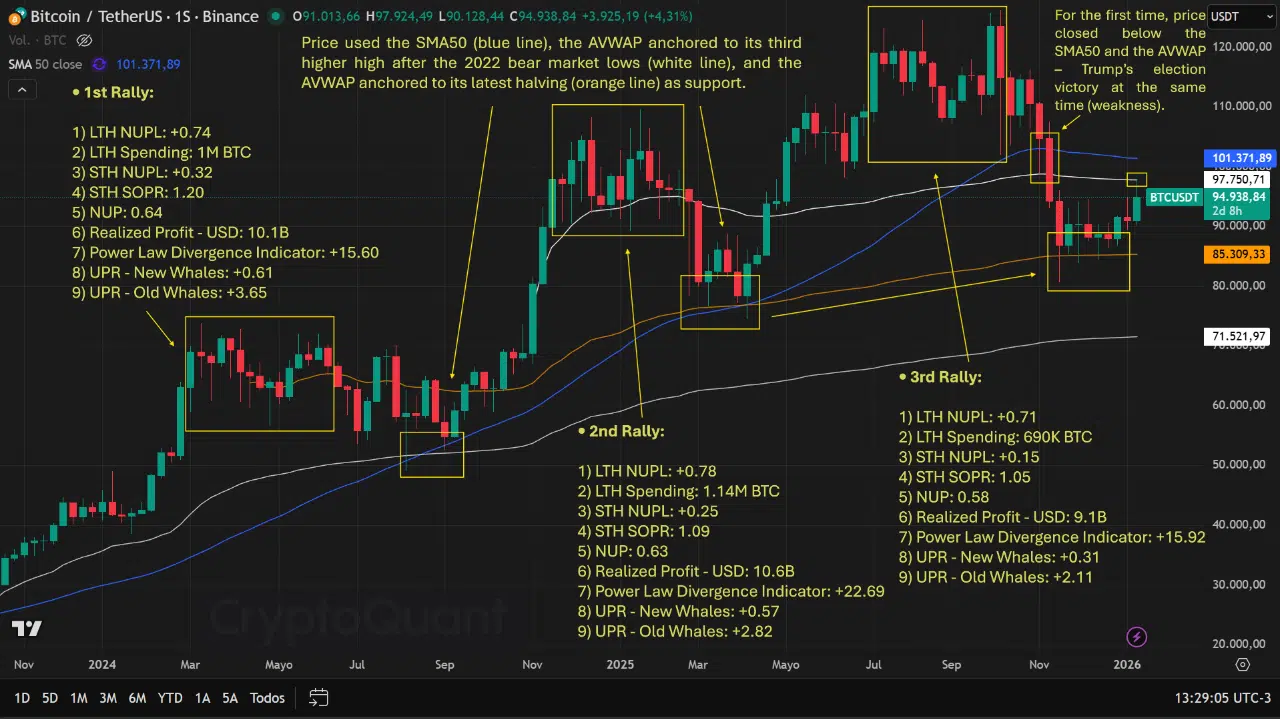
On the chart shared by CryptoQuant, BTC is shown closing beneath the 50-day simple moving average near $101,371, as well as below key anchored VWAP levels tied to the 2022 bear market low and the most recent halving.
The move marks a notable shift in structure. According to the same chart, this is the first instance in the current cycle where price has settled below both the SMA50 and the highlighted AVWAP bands at the same time, breaking a pattern that previously defined support during earlier advances.
Three Rallies, Three Very Different Profit Profiles
CryptoQuant’s analysis breaks the current cycle into three distinct rallies and compares on-chain profit metrics across each phase. The data shows that the second rally was the most favorable for long-term holders. During that leg, LTH NUPL peaked at 0.78 while LTH spending reached 1.14 million BTC, indicating the highest unrealized profit margins and the most aggressive distribution by veteran holders.
In contrast, long-term holders distributed roughly 35% to 40% less BTC during the third rally compared with the first two. While LTH NUPL remained positive at 0.71 in the latest leg, spending activity dropped sharply to 690,000 BTC, pointing to more restrained profit-taking despite higher prices.
Short-term holders followed a different pattern. Their strongest window came during the first rally, when STH NUPL reached 0.32 and STH SOPR hit 1.20. By the third rally, those figures had compressed to 0.15 and 1.05, reflecting much thinner gains for newer market participants.
Whale Profits Fade as Distribution Slows
Whale behavior also shifted meaningfully across the cycle. The largest unrealized profit margins for whales appeared during the first rally, with new whales posting a UPR of 0.61 and old whales reaching 3.65. Those margins declined steadily in the second and third rallies, with new whales briefly moving into negative territory during the most recent drawdown.
Indicators that capture broader market participation reinforce the same conclusion. The second rally recorded the highest realized profit in dollar terms at $10.6 billion and the highest power law divergence reading at 22.69. NUP remained elevated at 0.63 during that phase, confirming widespread profitability across the network.
Structure Weakens as Price Breaks Key Anchors
The chart also highlights how recent weakness aligns with external timing. Bitcoin’s breakdown below the SMA50 and AVWAP coincided with a broader market pullback following Trump’s election victory, a moment labeled directly on the chart as a point of weakness.
Taken together, the CryptoQuant data shows a cycle where each successive rally has produced more compressed gains. While price remains historically elevated, on-chain profit metrics suggest diminishing upside intensity, with the second rally standing out as the most euphoric and profitable phase so far.