

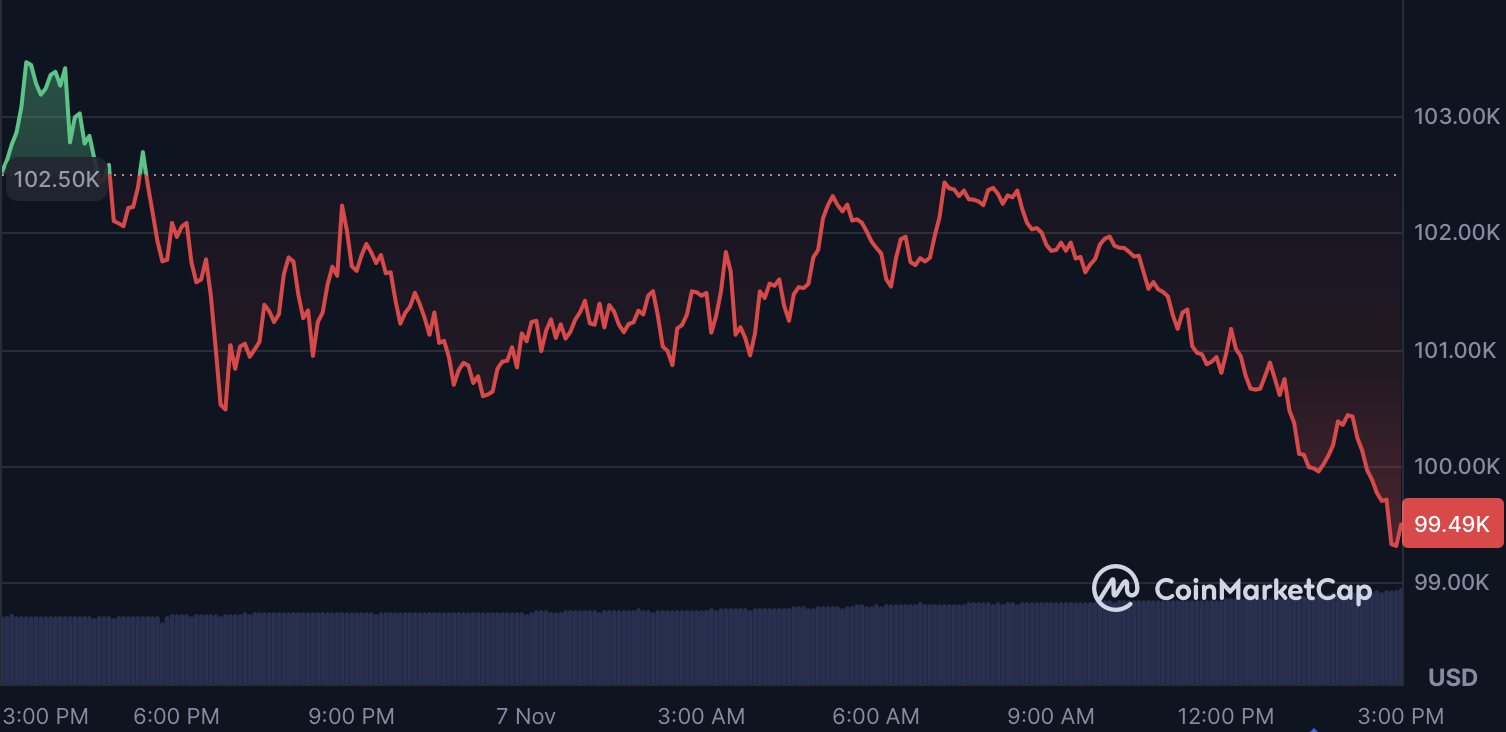
Bitcoin's price slipped below $100,000 on Thursday, marking its lowest level in nearly three weeks as ETF outflows, whale selling, and technical breakdowns weighed on market sentiment.
Key Takeaways
- •Bitcoin spot ETFs saw net outflows of $488.4 million, intensifying downside pressure.
- •Whales sold over $1 billion in BTC, overwhelming Tether’s recent $1B dip-buy move.
- •Bitcoin broke below key technical levels, signaling potential targets as low as $85,000.
Bitcoin was trading at $99,495, down 2.9% in 24 hours, with 24-hour trading volume surging 36% to nearly $80 billion, a sign of intensified volatility.
Spot ETF Outflows Weigh on Institutional Demand
Data from ETF Flow Tracker shows that U.S. spot Bitcoin ETFs recorded net outflows of $488 million, extending a trend that began in early October. Cumulative ETF assets under management have dropped by more than $5 billion, reflecting risk aversion among institutional investors amid macro uncertainty.
The 30-day correlation between ETF flows and Bitcoin’s price now stands at 0.87, highlighting how closely price movements mirror institutional capital flows.
Investors are watching today’s Michigan Consumer Sentiment Index release closely; weaker data could reinforce a risk-off tone, pressuring ETF inflows further.
Whale Sell-Offs Amplify Downside
On-chain data reveals that large Bitcoin holders sold 10,000 BTC (worth over $1 billion) this week, contributing heavily to the recent decline.
Although Tether reportedly purchased nearly $1 billion in Bitcoin during the dip, it wasn’t enough to offset the sell-side pressure from large holders.
Retail traders also appear to be capitulating. Over the last 10 days, more than 37,000 small wallets holding under 10 BTC have exited positions, the largest exodus since March 2024, according to CoinMarketCap data.
Technical Breakdown Signals Lower Targets
From a technical perspective, Bitcoin has decisively broken below its 23.6% Fibonacci retracement level at $118,219 and the 55-day moving average near $110,125.
Momentum indicators confirm the bearish setup: the 14-day RSI sits at 34.4, indicating continued downside pressure.
Analysts are now eyeing the 38.2% Fibonacci level at $114,539 as the next major resistance.
A daily close below $98,962, the most recent swing low, could trigger a cascade toward $85,000, the next significant support zone.