

The Bitcoin price has experienced a fractional increase in the last 24 hours, trading at $95,324. This movement coincides with a robust return for spot Bitcoin ETFs, which recorded significant net inflows totaling $1.42 billion over the past week.
ETF activity was particularly concentrated in the middle of the week. Data indicates that Wednesday saw the largest single-day inflow, approximately $844 million, closely followed by $754 million on Tuesday. Although trading momentum moderated towards the week's end, including a notable $395 million outflow on Friday, the substantial buying in the midweek was sufficient to drive total weekly inflows to their highest point since early October. During that earlier period, spot Bitcoin ETFs attracted around $2.7 billion, underscoring the renewed institutional interest.
This recent trend in inflows suggests a gradual return of institutional investors to Bitcoin through regulated investment products, following a period of market caution. Vincent Liu, chief investment officer at Kronos Research, commented that ETF inflows are indicative of long-only allocators re-entering the market. He further stated that this ETF buying, combined with reduced selling from large Bitcoin holders, often referred to as whales, is contributing to a tightening of effective supply.

On-chain data reveals that whale selling pressure has diminished compared to late December, thereby reducing a primary source of distribution and downside risk. Ethereum ETFs also experienced positive inflows, albeit at more modest levels than Bitcoin. The strongest inflow day for Ethereum ETFs occurred on Tuesday, with approximately $290 million, followed by $215 million on Wednesday. However, late-week selling impacted performance, with Friday seeing roughly $180 million in outflows, bringing total weekly inflows for Ethereum ETFs to around $479 million.
Despite the encouraging inflow data, analysts maintain a degree of caution. Market observers point out that historically, short-lived spikes in ETF inflows have often resulted in brief price rebounds rather than sustained rallies. Analysts suggest that Bitcoin will likely require several consecutive weeks of strong and consistent ETF demand to support a durable uptrend. Without sustained inflows, price gains may continue to encounter resistance and fade during periods of weaker demand.
Bitcoin Price Consolidates Above Key Support After Bullish Breakout
Bitcoin (BTC) is demonstrating steady consolidation following a significant bullish breakout, as indicated by the latest 4-hour chart analysis. At the time of writing, the price is trading at $95,470. The chart highlights a critical support zone situated near the $86,000–$88,000 range, an area where Bitcoin previously established a solid base.
This region served as a demand zone, effectively absorbing selling pressure and creating the conditions for a subsequent rebound. From this level, BTC began to form a rounded bottom pattern, a recognized bullish structure that typically signals a gradual transition from bearish to bullish market momentum. The bullish sentiment was further confirmed when the price broke above a key resistance zone between $91,000 and $92,000, a move clearly marked as a bullish breakout on the chart. Following this breakout, Bitcoin experienced a sharp rally, reaching the $97,000–$98,000 area, where sellers temporarily exerted pressure. This level is now acting as short-term resistance.
Currently, BTC is trading sideways just below this resistance level, which is characteristic of healthy consolidation rather than a sign of weakness. The price is holding above the former resistance zone, which has now effectively flipped into support around the $94,500–$95,000 mark. This behavior often suggests that buyers are actively defending higher price levels while preparing for a potential continuation of the upward move.
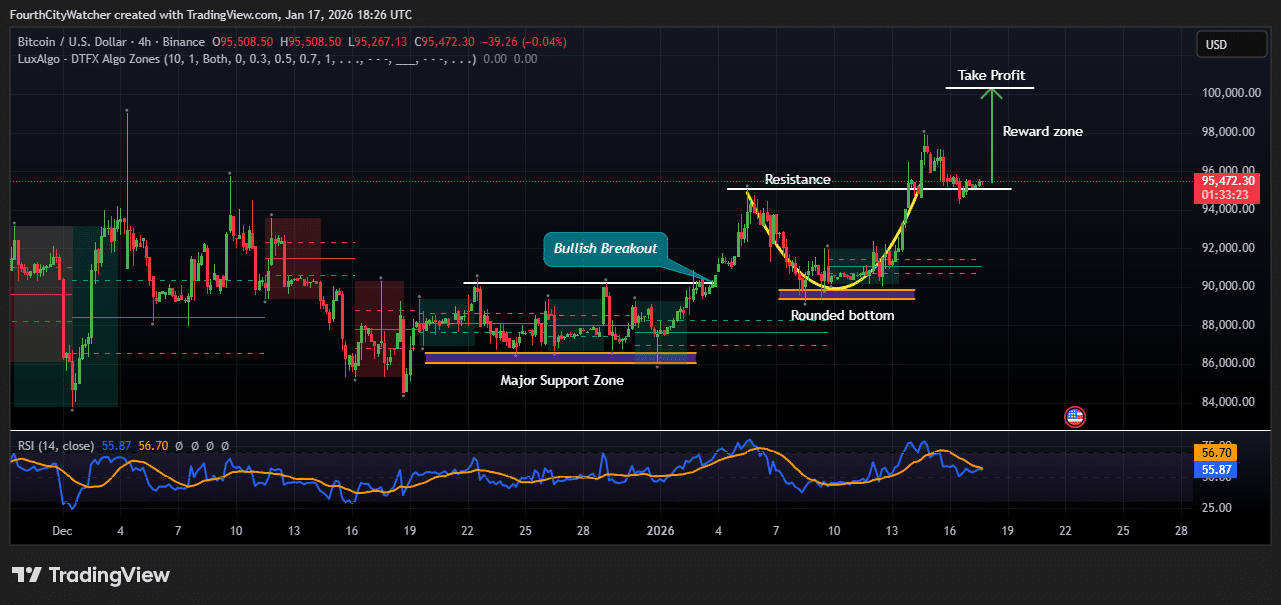
The chart also identifies a reward zone targeting the significant psychological level of $100,000, which aligns with the projected take-profit area. A clear break and sustained close above the $96,000–$97,000 resistance could pave the way for a retest of six-figure prices in the near term.
Momentum indicators provide additional support for this positive outlook. The Relative Strength Index (RSI) is currently hovering around the mid-50s, indicating neutral-to-bullish momentum. Importantly, the RSI is neither in overbought nor oversold territory, suggesting there is room for further upside potential should buying pressure increase.
The overall technical structure remains constructively bullish, provided that Bitcoin maintains its position above the $94,000 support zone. A decline below this level could potentially lead to short-term pullbacks toward $92,000. However, unless BTC loses the major support found near $88,000, the broader trend is expected to continue favoring bullish sentiment.