

Key Insights
- •A top analyst's Bitcoin price prediction suggests a recovery path following a potential drop to $95,000.
- •If a specific fractal pattern plays out, Bitcoin could experience another rebound and retest the $110,000 level.
- •The current Bitcoin 30-week cycle appears to be maturing, with price action showing weakness near key support and momentum indicators declining.
Bitcoin Price Prediction: Analyst on Recovery After Dip to $95k
The drop below the 300 moving average indicates a Bitcoin price prediction of a V-shaped recovery after a possible correction below the $100,000 mark. Historically, each dip below this moving average has often signaled exhaustion among sellers, leading to decisive bullish reversals.
Examining the daily Bitcoin chart, the 300 moving average has consistently acted as support since early 2023. Every touch or brief breakdown below this level has attracted aggressive buying pressure, subsequently fueling strong recoveries and supporting positive Bitcoin price predictions. The most recent instance of this pattern resulted in a sharp "V-shaped" reversal, emphasizing the technical significance of this moving average.
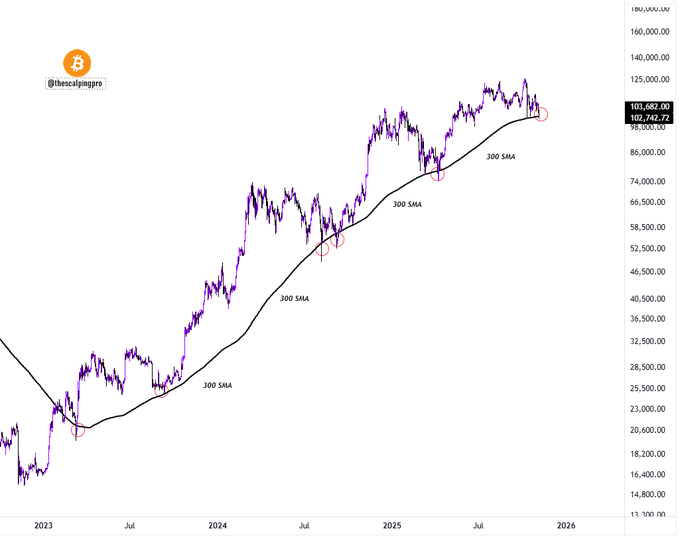
At the time of writing, BTC appears to be following a similar pattern, with price action softening from mid-year highs and BTC USD hovering just below the critical support zone. If the observed fractal pattern proves successful, the Bitcoin price could rebound and reach $110,000. However, a sustained close below the 300-day SMA might open the door for deeper corrections before the next upward movement.
Bitcoin 30-Week Cycle Has Matured, Claims Expert
According to analyst Bob Loukas, the current 30-week cycle for Bitcoin price is showing signs of maturation. This is evidenced by softening price action near key support levels and a rollover in momentum indicators. Historically, this phase of the BTC USD cycle has tested traders' conviction before a significant directional move occurs.
The charts indicate a well-defined structure within Bitcoin's cyclical pattern, with each cycle lasting approximately 30 to 32 weeks. Bitcoin USD has followed a similar trajectory in previous cycles, characterized by an early bottom, a robust mid-cycle advance, and a final corrective phase.
Bitcoin Price Lost Main Support
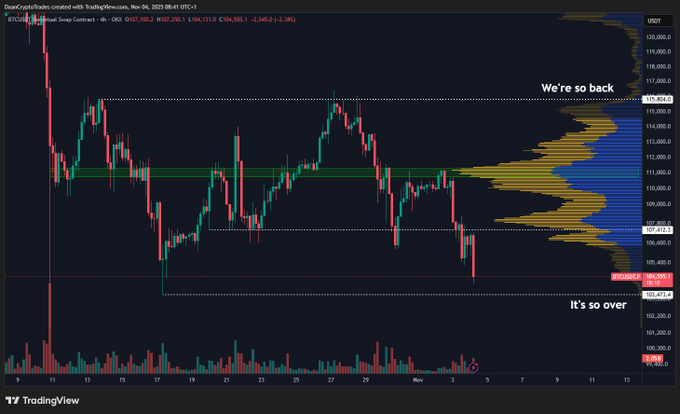
Despite earlier Bitcoin price predictions, the cryptocurrency has fallen below a crucial support zone that had sustained prices for several weeks. Analysis from Daan Crypto Trades clearly shows that the $106,000–$107,000 region, previously a stable floor, has now been breached. This leaves the market vulnerable to a more significant pullback toward the lower boundary of the recent trading range.
This breakdown occurs as Bitcoin USD approaches the same area where it previously established a higher low after the sharp recovery from the October 10 liquidation event. This level now represents the final layer of structural support for Bitcoin price before a broader retracement could potentially develop. The visible range volume profile indicates a sharp decrease in traded volume below current price levels, suggesting limited liquidity and an increased risk of accelerated downside if selling pressure persists.
Meanwhile, external market conditions beyond the cryptocurrency space contribute to a cautious sentiment. Persistent whale distribution continues to create headwinds that the market finds challenging to absorb. A decisive reclaim of the lost support zone would serve as the initial signal that buyers are regaining control. Until then, Bitcoin price remains in a technically vulnerable position, and maintaining patience may be the most prudent strategy.
Data Suggests Capitulation Phase Will Give Investors Attractive Entry Points
Selling pressure has once again placed strain on recent Bitcoin buyers, with many now facing unrealized losses. According to on-chain data from Glassnode, the Net Unrealized Profit/Loss (NUPL) indicator for short-term holders has entered the "capitulation" territory.
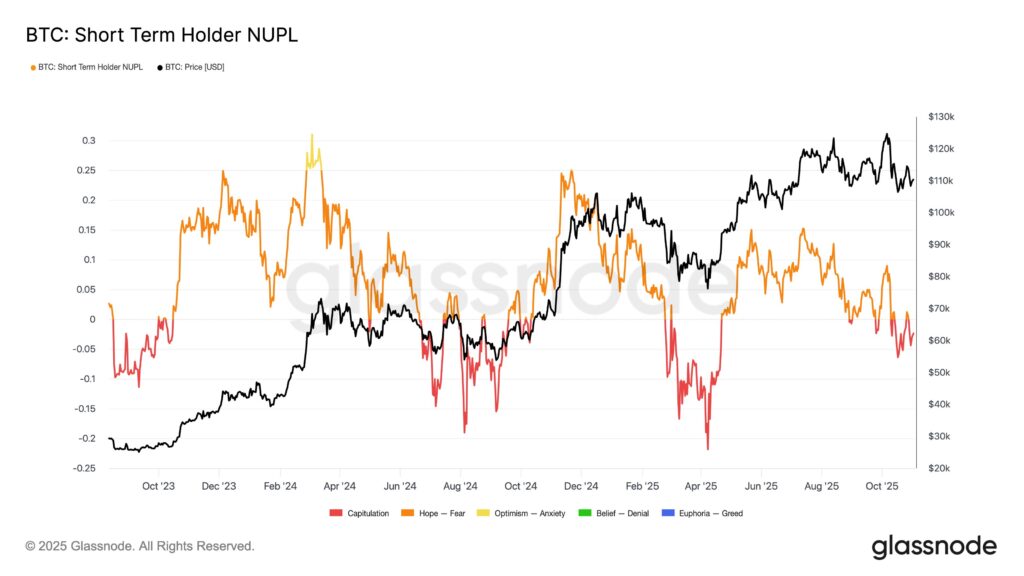
As of this week, NUPL registered at -0.058, a level approaching its weakest reading since April. Glassnode noted on X that in the past, similar moments of stress among short-term holders have frequently coincided with strong accumulation phases for longer-term, patient investors.