

The Bitcoin price saw a slight decrease of a fraction of a percent in the past 24 hours, trading at $113,618 as of 4:03 a.m. EST. Trading volume surged by 25% to $67.4 billion.
Traders are adopting a cautious stance in anticipation of the Federal Open Market Committee (FOMC) interest rate decision today. The market widely expects a 25 basis point cut in the benchmark rate.
⚠️ Volatility Alert 🎢
Fed rate cut decision today at 11:30 pm (IST)
Crypto market is in pressure and #Bitcoin stuck between $110K and $116K as most of the people await Fed rate decision and US-China deal. pic.twitter.com/rzjw2rax64
— BITCOIN EXPERT INDIA (@Btcexpertindia) October 29, 2025
While this rate cut is largely priced into the market, it is expected to be a positive development for higher-risk assets like cryptocurrencies, as it will help boost liquidity by reducing the cost of capital.
Traders are closely monitoring the liquidity situation, particularly in light of recent signs of renewed stress among US regional banks and an ongoing uncertain global macroeconomic environment.
The question remains: can a rate cut propel the price of Bitcoin higher?
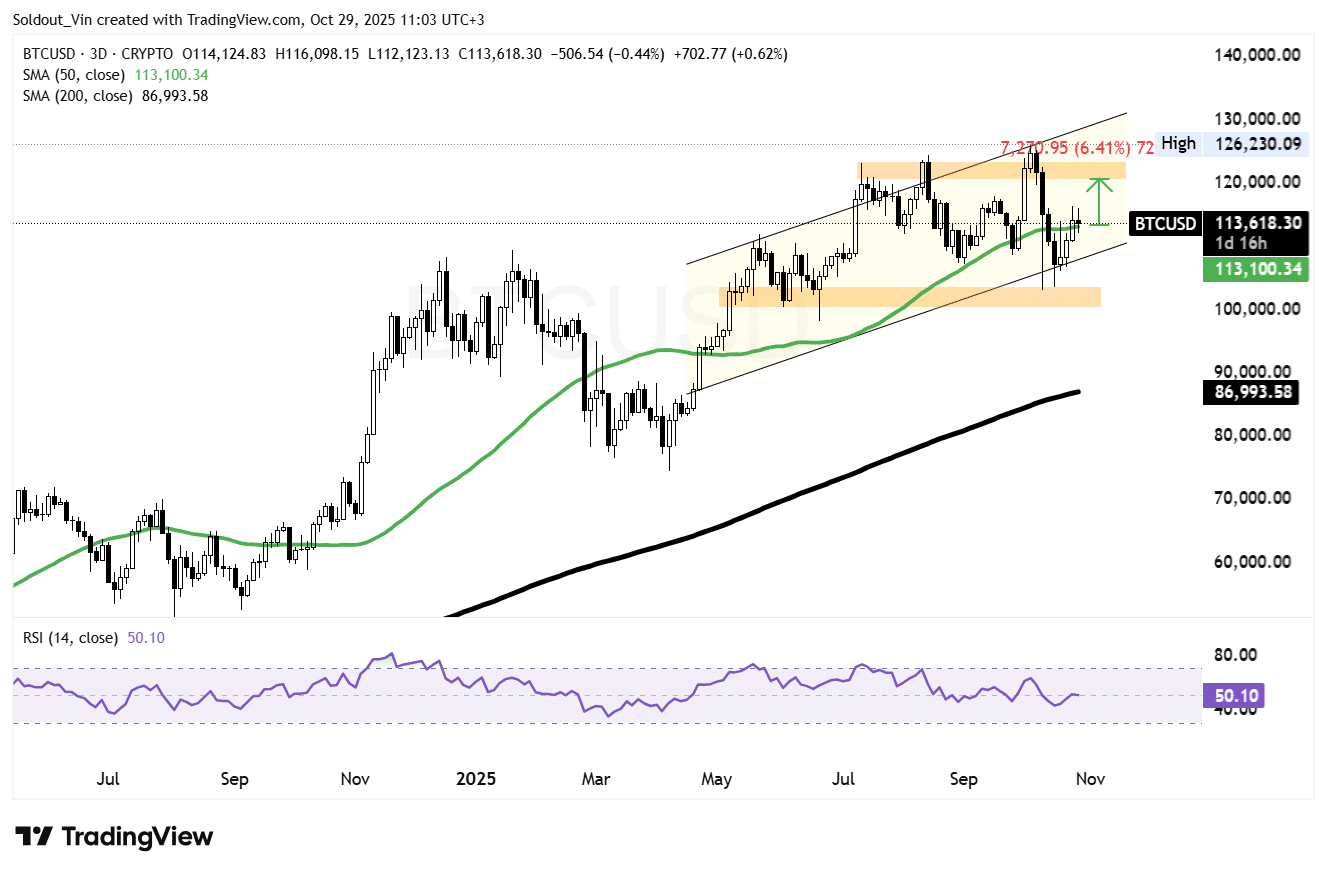
Bitcoin Price Consolidates Near Key Support As Bulls Defend $113K Region
The BTC price is exhibiting early signs of exhaustion after failing to sustain momentum above the $120,000 zone. The market is currently consolidating within a narrowing, rising channel.
Trading around $113,618, the Bitcoin price is holding slightly above the 50-day Simple Moving Average (SMA) at $113,100. This level is a critical short-term support that has guided the bullish rally since mid-2025.
The price action for BTC has turned cautious following multiple rejections near the upper boundary of the rising channel, around $126,000. This zone has consistently capped any attempts to break out and has now become the primary resistance level for Bitcoin’s price.
Meanwhile, the 200-day SMA, currently situated around $86,993, remains well below the BTC price, reinforcing the bullishness of the macro structure.
However, the short-term trajectory is becoming increasingly fragile as the 50-day SMA begins to flatten, indicating a potential loss of upward momentum.
The Relative Strength Index (RSI) is currently at 50.10, suggesting that BTC is in a state of equilibrium, neither strongly bullish nor bearish. This indicates a period of market indecision, awaiting a catalyst, such as the FOMC decision, to determine the next significant move.
BTC Targets The $120,800 Zone
From a structural perspective, the $113,000–$115,000 zone now represents a critical support area. This zone aligns closely with the 50-day SMA and the mid-range of the rising channel pattern.
A rebound from this level could reignite buying interest and propel the price of BTC back toward the $126,600 resistance band, which is approximately 6.4% higher than current levels.
Conversely, a sustained close below $113,000 could trigger increased selling pressure, potentially exposing the $105,000–$100,000 region. This area coincides with the lower boundary of the rising channel and has historically acted as a strong demand zone.
This bearish sentiment is further supported by the TD Sequential indicator, as highlighted by popular analyst Ali Martinez on X, who notes that the sequence is flashing a sell signal.
TD Sequential has called every Bitcoin $BTC swing.
– July: Sell = 7% correction
– August: Sell = 13% correction
– Early September: Buy = 10% rebound
– Late September: Buy = 15% rally
– Early October: Sell = 19% correctionIt’s now flashing a sell signal! pic.twitter.com/kNoxWiY14l
— Ali (@ali_charts) October 29, 2025
For the time being, Bitcoin traders are maintaining a cautious approach. Sentiment is balanced between the bullish support of the channel and the resistance pressure near all-time highs, with the impending FED rate cut decision being a key factor.