

Key Market Indicators
Prominent analyst PlanB announced on X that Bitcoin’s monthly RSI is at 66, signaling a strong upward trend.
This suggests a possible extended bullish period for Bitcoin, potentially influencing broader cryptocurrency market dynamics.
Analysis of Historical Cycles and Future Outlook
Investors and traders are closely monitoring Bitcoin’s RSI. Historical cycles have shown that an RSI exceeding 80 often leads to prolonged bull markets, as seen in 2011, 2017, and 2021. PlanB's analysis suggests anticipation of Bitcoin reaching new highs, aligning with his previous predictions of market cycles.
Market reactions have been positive, with increased enthusiasm among traders. The lack of direct comments from major institutions doesn’t deter optimism. Nonetheless, key voices in the community express hope that this RSI level may signal the beginning of a new upward phase for Bitcoin.
"Bitcoin's current RSI is 69. I expect it to exceed 80 for at least four consecutive months, just like during the 2021, 2017, and 2013 bull markets." - PlanB, Analyst, S2F Model Creator
Current Market Position and Expert Insights
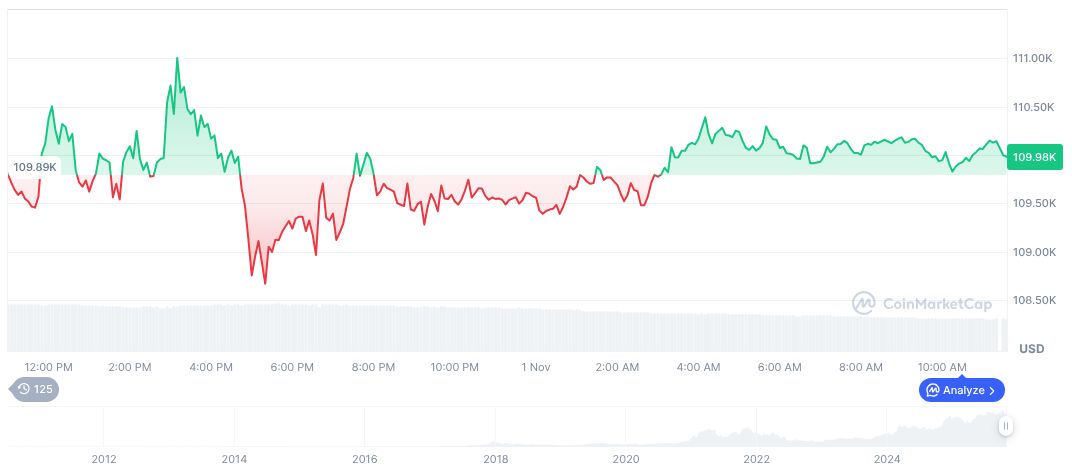
Bitcoin's current price is $110,830.79, with a market cap of $2.21 trillion. Trading volume saw a decline of 36.71%, yet Bitcoin maintains a dominant presence at 59.21% in the market. Recent price changes indicate slight fluctuation, reflecting a modest 0.68% gain in the last 24 hours despite a downward trend of 7.91% over the past 30 days, according to CoinMarketCap data.
Experts from the Coincu research team note that an increased RSI may stimulate interest and confidence among investors. This aligns with past trends where enhanced momentum indicators led to notable influxes in capital and broader market excitement as momentum traders capitalize on such signals.