

Bitcoin's recent sharp decline has significantly impacted the cryptocurrency market, leading to the liquidation of over $1.36 billion in leveraged trades within a single day. The leading cryptocurrency experienced a notable drop, falling below the $105,000 mark. This downturn also marked the first time Bitcoin closed October in negative territory in six years, breaking its consistent 'Uptober' streak.
At the time of reporting, Bitcoin (BTC) was trading around $104,003, reflecting a 2.56% decrease in the past 24 hours. Trading activity for Bitcoin surged to $79.2 billion as traders reacted swiftly to the price dip. The overall cryptocurrency market value decreased by 3.26% to $3.47 trillion, while total trading volume saw a substantial increase of almost 63%, reaching $224.87 billion.
Market Under Pressure
Technical indicators suggest Bitcoin is currently lacking upward momentum. Data from TradingView's 4-hour chart shows BTC trading at $104,000, down 0.43%. The cryptocurrency has repeatedly attempted to break through the $108,500 level, which has now solidified into significant resistance.
The widening Bollinger Bands are indicative of increasing price volatility, with sellers maintaining a strong presence around the $104,000 support level. Bollinger Bands are a tool used by traders to gauge market volatility by identifying periods when prices deviate significantly from their average, potentially signaling an upcoming reversal.
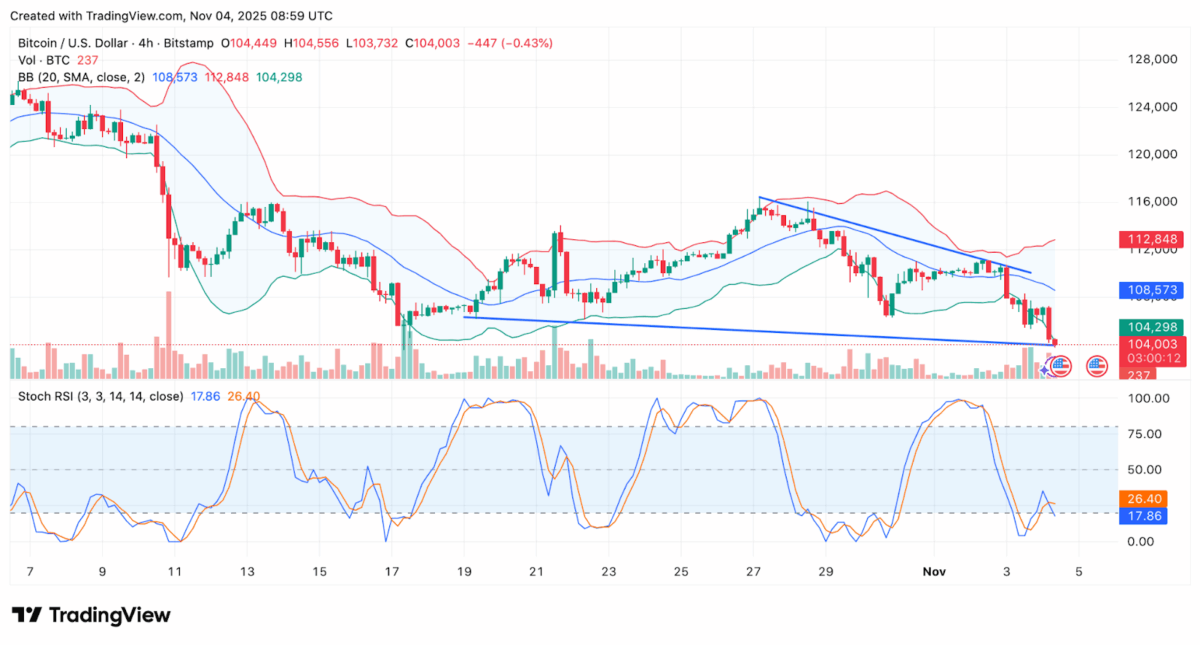
The Stochastic RSI Indicator, which measures the strength of the Relative Strength Index (RSI), is currently at 17.86, indicating that Bitcoin is in oversold territory. Typically, the Stochastic RSI is considered overbought when above 80 and oversold when below 20. This situation could potentially lead to a brief rebound if buyers re-enter the market. However, if buyers fail to regain control promptly, Bitcoin may face further downward pressure due to the persistent downtrend observed on the chart.
Massive Liquidations Shake the Market
Data from Coinglass reveals that over 336,000 traders experienced liquidations in the last 24 hours, resulting in a cumulative loss of approximately $1.36 billion. The majority of these losses, around $1.22 billion, were from long positions, indicating that traders who bet on price increases bore the brunt of the downturn. Bitcoin recorded the largest liquidation amount at $23.9 million, followed by Ethereum (ETH) with $12.06 million. Other prominent cryptocurrencies such as XRP and Solana (SOL) also experienced significant, though smaller, losses.

The single largest liquidation occurred on HTX, involving a Bitcoin-USDT trade valued at approximately $47.87 million. An additional $400 million in positions were wiped out in a mere four-hour period, underscoring the rapid acceleration of the market sell-off. These rapid liquidations contributed to more dramatic price drops, intensifying the severity of this downturn across exchanges.
Analysts Explain Market Behavior
Crazzyblockk, an analyst at CryptoQuant, discussed how the Realized Cap metric provides insight into current market behavior. "In mid-July, when Bitcoin reached around $120,000, the market entered a distribution phase," the analyst stated. Long-term holders (LTHs) began selling, causing LTH Realized Dominance to decrease from 55% to 46%.
Furthermore, short-term holders initially accumulated these coins but subsequently sold them during price dips, intensifying bearish sentiment. CryptoQuant confirmed on X, "Has been the pattern in recent months: long-term investors selling to take partial profits, while new market entrants accumulate and hold for longer periods."
Emmett Gallic also pointed to whale activity as a contributing factor to the market shift. "A Bitcoin Whale that hasn’t moved funds in 6 years deposited 2300 $BTC to Paxos 13 hours ago," he reported, noting that the whale holds over 31,000 BTC, valued at approximately $3 billion.
Despite these movements, Crazzyblockk expressed optimism that the market correction is nearing its conclusion. The continued conviction shown by many new holders suggests that underlying bullish momentum remains intact.
Macro and Market Dynamics
The recent market event follows the "Red October" period, which occurred amidst a complex macroeconomic landscape. U.S. Federal Reserve Chair Jerome Powell initially announced the cessation of quantitative tightening, but later tempered expectations for interest rate cuts, which unsettled investors.
As a result, risk assets, including Bitcoin, experienced declining returns. Data from Velo indicates that Bitcoin's U.S. session returns dropped from 0.94% on October 29 to -4.56% over the preceding week.
Additionally, geopolitical tensions have somewhat eased following the Trump-Xi truce, which paused tariff increases and reduced global market anxiety. However, analysts maintain that structural selling pressures continue to weigh on Bitcoin's price.
Crypto analyst Julio Moreno explained, "Instead of looking at Bitcoin long-term holder distribution/spending, I like to look at the other side of the trade. Is there enough demand to absorb the supply at higher prices? Since a few weeks ago the answer is no."
Similarly, analyst Quinten emphasized, "Long-term holders dumped 400,000 Bitcoin in the last 30 days. That’s nearly 2% of supply." He added, "If Bitcoin can stay above $100,000 while whales unload hundreds of thousands of coins, you don’t want to know what it’ll do when the real demand turns on."
Why This Matters
Bitcoin's recent fall below $104,000 highlights the rapid shift from market optimism to concern. Numerous traders incurred losses, and the movement of large investor holdings exacerbated prevailing fears. Nevertheless, certain indicators suggest a potential price rebound if buyer interest re-emerges. This indicates that confidence has not entirely dissipated, although the path forward appears to be volatile. Given the ongoing global uncertainties, traders should anticipate continued price fluctuations before market stability is restored.