

Bitcoin (BTC) experienced a sharp recovery on November 10, 2025, closing the day at $106,404. This rebound followed an intraday low of $104,265 recorded on Binance. The daily chart indicates a 1.61% increase, with the cryptocurrency forming within a descending channel that began in late October. This recovery aligns with the Relative Strength Index (RSI) showing signs of breaking its downtrend resistance, suggesting the emergence of early momentum for a short-term reversal.
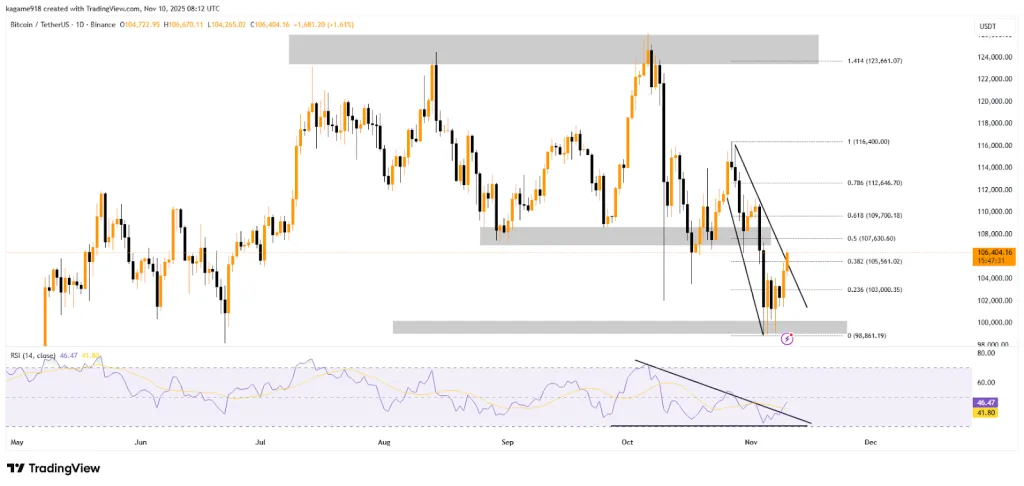
Bitcoin's price recently touched a significant support area situated between $98,861 and $100,000. This zone corresponds to the lower boundary of the established channel and also aligns with the 0.236 Fibonacci retracement level at $103,000, providing a solid foundation for the recent upward movement. Conversely, Bitcoin is now facing immediate resistance at $105,561 (0.382 Fib), followed by $107,630 (0.5 Fib), levels that are higher than its current trading price.
A successful breakout beyond the $109,700 mark (0.618 Fib) could potentially propel Bitcoin towards $112,646. This target is significant as it represents the 0.786 Fibonacci retracement level. The RSI is currently positioned near 46.47, slightly above its moving average of 41.80. This movement follows the formation of a bullish divergence against lower price lows, a pattern that historically has preceded rallies of 8-12% when Bitcoin consolidates near demand zones.
Technical Indicators Signal Strength Across Key Zones
Bitcoin's current price is approximately halfway through its recovery area, encountering the strongest resistance between $109,000 and $116,400. This range is particularly important as it overlaps with the Fib 1.0 extension and the lower highs established in early October. Should buyers successfully overcome this range, the next upside target is projected around $123,661, which is linked to the Fib 1.414 extension and also represents a significant liquidity area.
Conversely, if Bitcoin fails to sustain its price above $104,000, it could trigger renewed selling pressure, potentially leading to a retest of the $98,800 support level. The chart suggests that Bitcoin has been following a broad wedge formation, indicating a decrease in volatility and building pressure for the next significant breakout.
Winklevoss’s $1 Million Bitcoin Call Fuels Optimism
In a recent interview with CNBC, Cameron Winklevoss, co-founder of Gemini, expressed a strong conviction about Bitcoin's future, stating, "Bitcoin is an easy 10x from here." His remarks come at a time when optimism is returning to the digital asset sector. Concurrently, Coinbase Global (NASDAQ: COIN) stock saw a gain of 0.82%, closing at $326.59, and has achieved a remarkable +313.53% year-to-date increase. Winklevoss's prediction is based on the growing institutional acceptance of Bitcoin and its robust underlying fundamentals.
Liquidation Heatmap Reveals $105K as a High-Risk Zone
According to liquidation heatmap data from Coinglass for the past week, the BTC/USDT pair on Binance experienced significant liquidation activity within the $104,000 to $106,000 range. The heatmap highlights areas with bright yellow spots, indicating liquidation volumes exceeding $80 million. This suggests a high level of risky trading activity characterized by elevated leverage ratios.
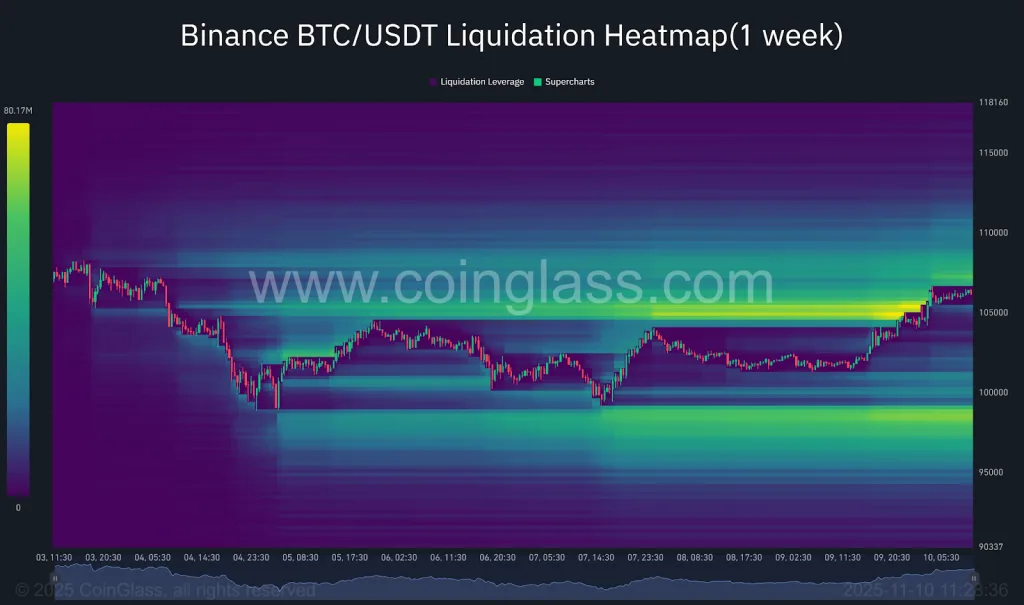
Earlier in the week, Bitcoin's price dipped below $98,000, but it subsequently staged a strong rebound, resulting in the liquidation of numerous short positions around the $100,000 level. Since then, the price has been trading sideways between $103,000 and $106,000, which has led to an increase in long positions as traders anticipate further price appreciation.
Current liquidation levels are below $110,000, suggesting a limited number of remaining short positions. This scenario could lead to sharp price movements if Bitcoin encounters resistance and breaks through it. The market is currently characterized by heightened tension, with the buildup of leverage indicating that traders are operating at the edge, balancing risk and reward within a narrowing price range.