

Bitcoin has returned to one of the most important decision zones of the entire cycle, with analysts closely comparing today’s structure to the breakdown pattern that triggered the 2021 bear market.
After a sharp correction through November, BTC has now retested its multi-year downtrend and is attempting to bounce from the same type of level that failed four years ago.
A Familiar Breakdown Pattern, But With a Twist
Merlijn The Trader highlighted that Bitcoin is repeating the exact setup that marked the start of the 2021 collapse. Back then, BTC broke down from its support retest and began an extended downtrend.
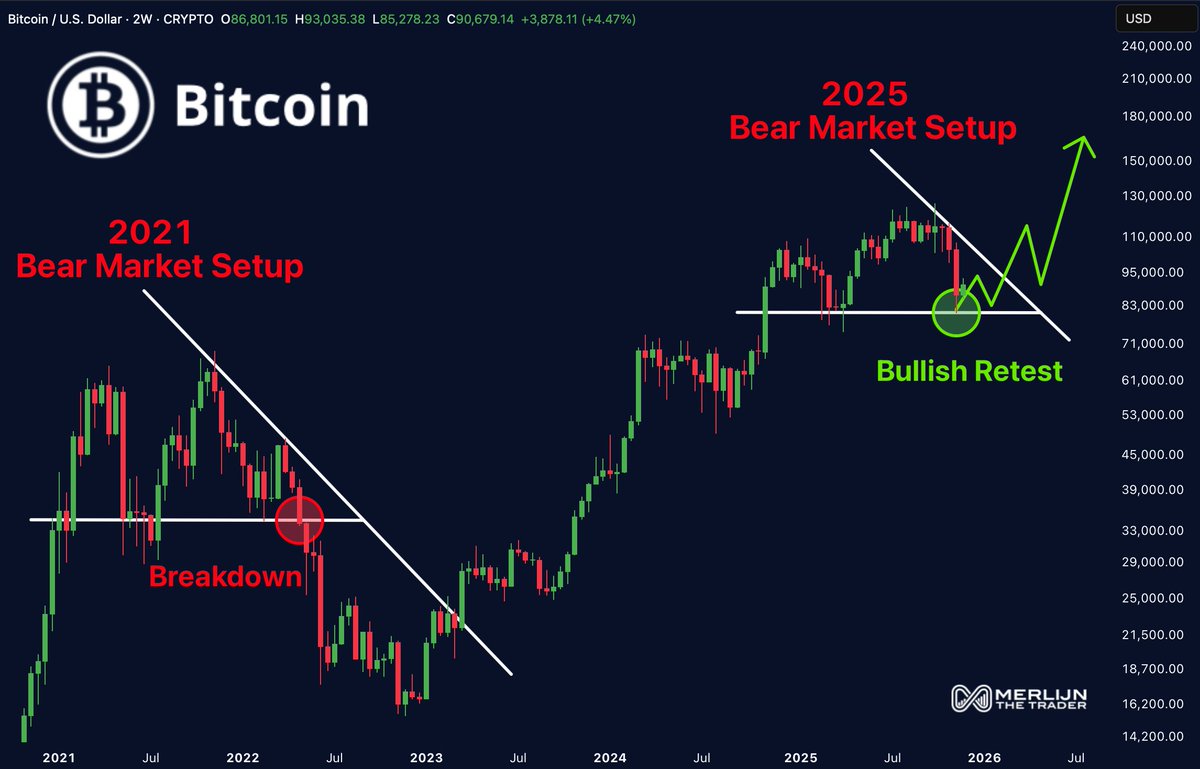
Today, the structure looks similar, but the outcome is not identical. Instead of breaking lower, Bitcoin has bounced on the retest, creating what Merlijn describes as a potential “bullish retest” that could flip the entire narrative if buyers hold the line.
On the weekly chart, BTC has spent roughly 2.5 years traveling inside a rising channel. Price is now sitting directly on the channel base. Historically, this is where major trend direction is decided. A sustained bounce implies cycle continuation. A breakdown signals capitulation.
Key Resistance Ahead: Michaël van de Poppe’s Outlook
Michaël van de Poppe added that Bitcoin is now facing its first major resistance zone: the 20-day moving average combined with a horizontal block that previously acted as seller control.
He expects this area to be used for profit-taking before the market can attempt a stronger recovery. His base case is a consolidation phase into December, as the recent bounce increases the probability that BTC established a bottom during the last two weeks of selling pressure.
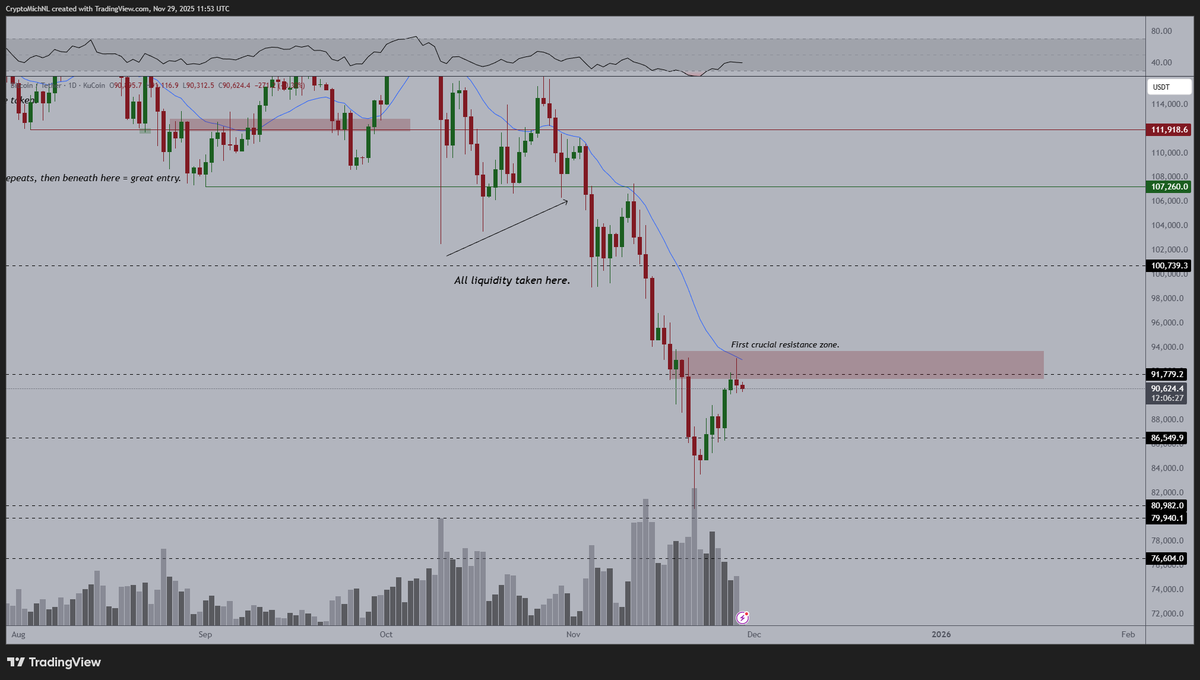
Volume profiles show liquidity absorption beneath the recent lows, while the daily chart identifies the first legitimate rejection zone at roughly $91,000–$94,000. Failure to reclaim it would confirm that sellers still dominate the short-term structure.