

Current Market Status
Bitcoin is currently trading within a defined range, with market participants closely monitoring two key price levels. The cryptocurrency is priced at $91,000, reflecting a modest gain over the past 24 hours and an approximate 10% increase over the last week.
Despite the recent upward trend, Bitcoin's price remains capped below a significant resistance level, while strong support is established at a lower point on the chart.
Key Price Levels Shaping Bitcoin’s Range
On-chain data analyzed by Ali Martinez indicates that Bitcoin is currently positioned between two zones of high transaction activity. The first is around $84,570, where approximately 610,635 BTC were last moved. This level signifies substantial historical transaction volume, suggesting strong buying interest that could potentially support the price during downward movements.
For Bitcoin $BTC, $84,570 is the support that matters, and $112,340 is the ceiling to watch. pic.twitter.com/rI0dhCgiMK
— Ali (@ali_charts) November 27, 2025
The next significant level to watch for potential supply increases is around $112,340. Near this price point, approximately 576,252 BTC were last traded. A smaller cluster of activity, with over 402,000 BTC moved near $104,765, may act as an additional resistance point before any attempt to reach the $112,340 level.
Resistance at $91,772 and Momentum Outlook
Bitcoin has been testing the area just below $91,800, a zone that has effectively served as a short-term cap, limiting further upward price movement. Analyst Michaël van de Poppe commented on the situation, stating:
“BTC needs to break this crucial level.”
Momentum has seen a resurgence following the recent bounce from the $82,000 region. However, without a decisive break above the current resistance, the future price direction remains uncertain. Should the upward trend persist, key levels to monitor include $107,260 and $111,918.
Furthermore, Lennaert Snyder observed that Bitcoin is currently consolidating near the $93,000 resistance level. He explained that a breakout above this point could lead the price towards $95,480. Conversely, a rejection at this level might result in a price retracement back towards $90,000 or even $87,800.
“If we lose $90,000 support, shorts to ~$87,800 are triggered,” he added.
Snyder also noted that $87,800 could serve as another support level for long positions if the price stabilizes there. The current compression near $93,000 suggests that a significant directional move is likely imminent.
Network Activity Signals Potential Moves
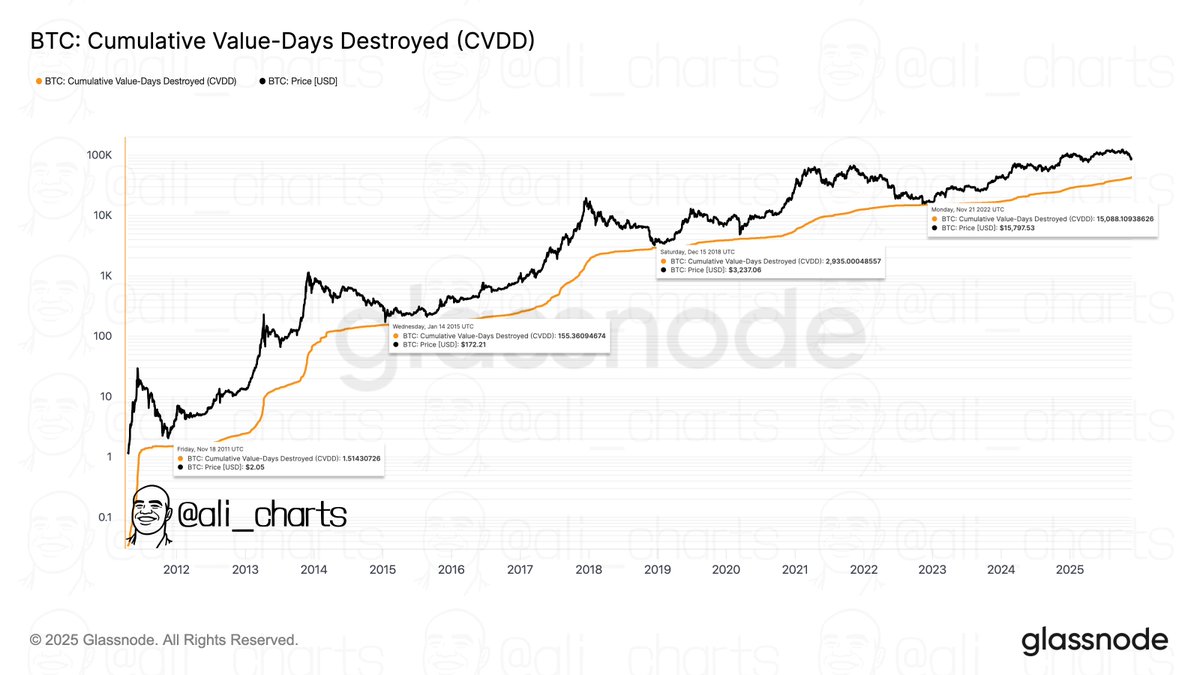
In related analysis, Ali Martinez referenced the Cumulative Value Days Destroyed (CVDD) metric as a tool for identifying market bottoms. This model tracks the movement of older Bitcoin units, providing insights into potential cycle lows. Historical data indicates that the CVDD has closely aligned with actual market bottoms during previous downturns.
“The CVDD has a solid track record of helping identify terminal bottoms,” he explained.
Separately, Daan Crypto Trades highlighted rising global liquidity as a potential catalyst for price appreciation. The Global Liquidity Index has shown an upward trend this week, which could support stronger price action if this trajectory continues.