

Bitcoin Magazine Pro has highlighted one of the most striking on-chain signals of the year: the 2-Year Rolling MVRV Z-Score has fallen to its most oversold reading ever recorded, even deeper than the capitulation extremes of 2015, 2018, and 2022. The chart shows the metric plunging well below previous cycle lows, raising a critical question for traders: Is this a textbook accumulation window, or could Bitcoin still drift lower?
An On-Chain Metric at Historic Extremes
The MVRV Z-Score compares Bitcoin’s market value to the value of coins based on when they last moved on-chain. The 2-year rolling version smooths out shorter-term noise and focuses on structural sentiment shifts within the network.
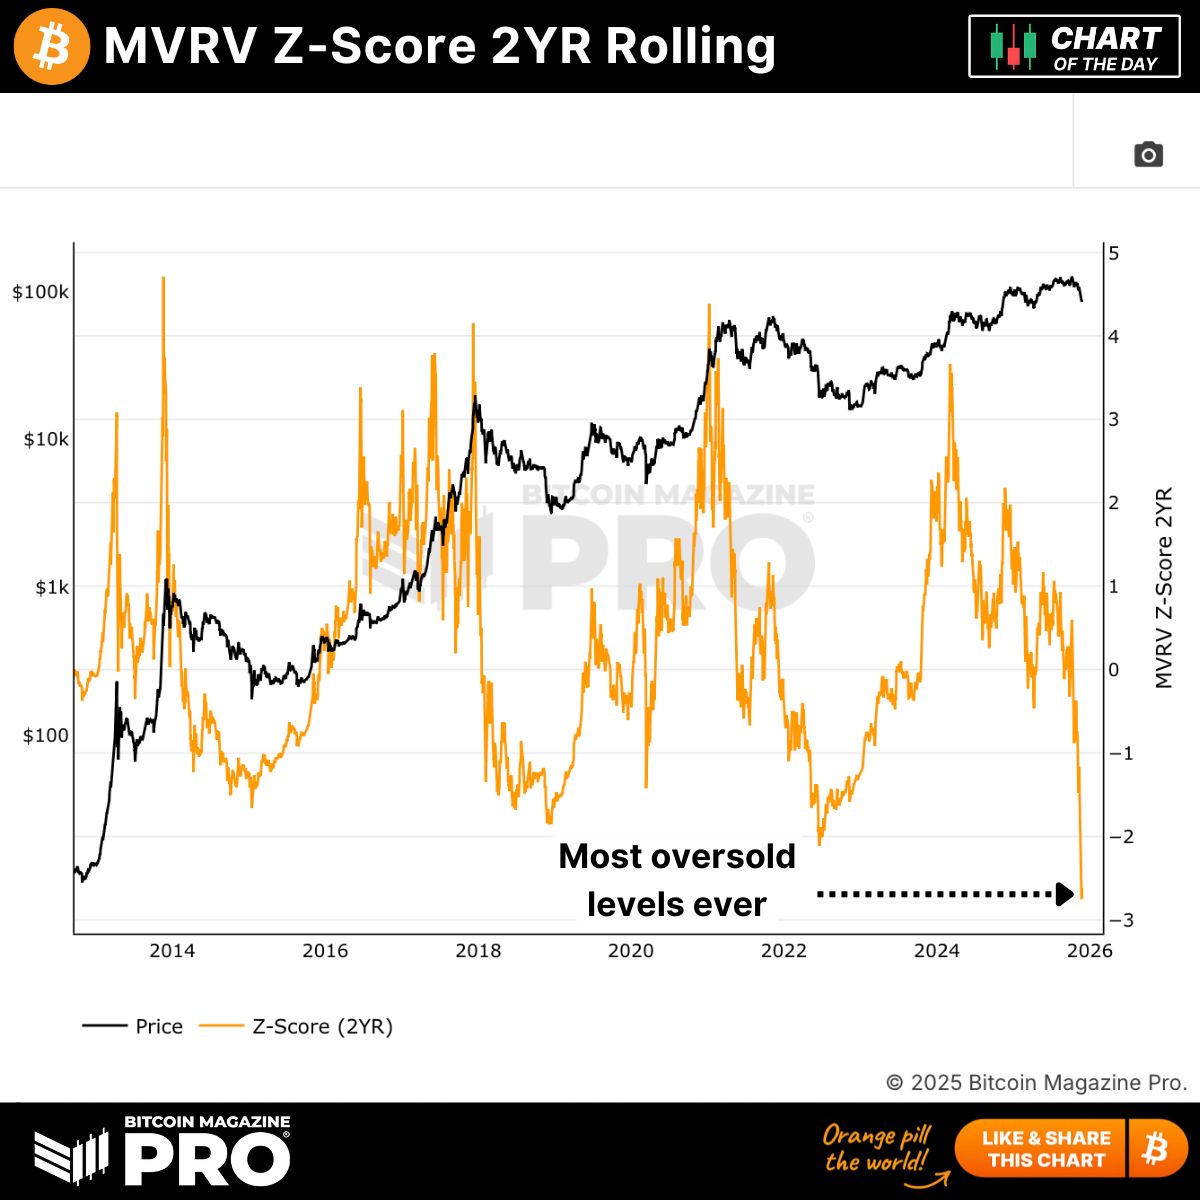
On the chart, the orange Z-Score line has collapsed to record-low territory, dropping below -2 for the first time. Historically, these deep negative readings have only appeared during:
- •The 2015 bear-market bottom
- •The 2018 capitulation phase
- •The COVID crash in 2020
- •The post-LUNA/liquidation capitulation in 2022
In every case, those extreme lows preceded some of Bitcoin’s strongest long-term rallies.
Oversold But Not Without Risk
The black price curve on the chart shows that BTC has pulled back sharply ahead of this signal. Oversold conditions do not guarantee an immediate rebound; previous cycles saw Bitcoin chop sideways or fall slightly lower before reversing.
However, what makes this reading notable is its depth. The current Z-Score is lower than all prior cycles, implying that long-term holders are underwater at unprecedented levels relative to market price. Historically, these conditions have been associated with heavy fear, forced selling, and the final stages of a broader reset.
Why This Matters for Long-Term Positioning
On-chain analysts often view deep negative MVRV readings as signals that Bitcoin is trading well below fair long-term value. If previous cycles are a guide, the current reading indicates a zone where smart-money accumulation tends to increase, even if short-term volatility continues.
In 2015, 2018, and 2022, similar extremes occurred just weeks or months before major cycle reversals. The magnitude of today’s reading suggests the market is experiencing one of the strongest capitulation-style resets of the Bitcoin era.
What Comes Next?
With the metric now at an all-time oversold low, market participants are watching closely:
- •If Bitcoin stabilizes from here, this could mark the early stages of a long-term bottom formation.
- •If selling pressure continues, the MVRV Z-Score could remain in negative territory, but historically, it has not stayed deeply oversold for long.
For now, the chart sends a clear message: Bitcoin is sitting in a historically extreme zone, one that has repeatedly preceded strong multi-year recoveries. Whether this becomes another classic accumulation moment will depend on how the market absorbs remaining volatility in the weeks ahead.