

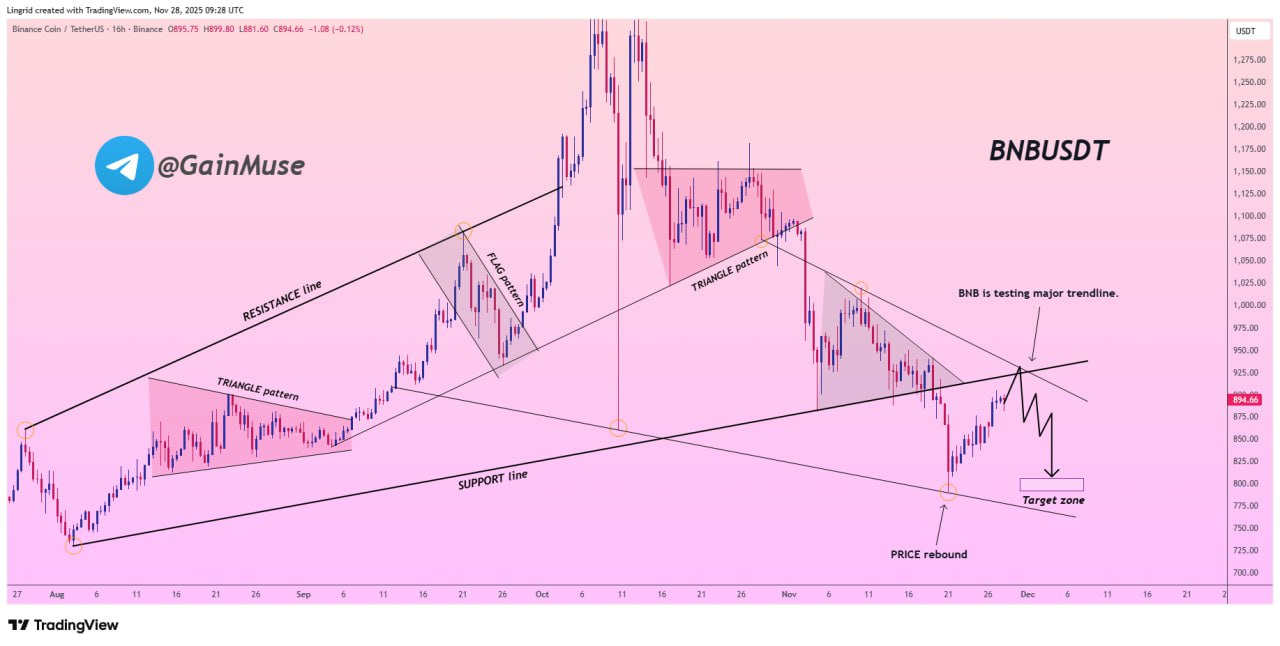
Binance Coin (BNB) is approaching one of the most important levels on its multi-month chart, pressing directly into a long-term trendline that has repeatedly acted as resistance.
After recovering from its recent support-line bounce, price momentum has slowed, and the broader structure still leans bearish. This creates a high-pressure scenario where any rejection could resume the dominant downward wave and drive BNB toward its projected target zone.
Market sentiment reflects this hesitation: BNB trades at $889, nearly flat on the day, while volatility remains elevated at 8.35%.
Trendline Test: Bulls Need a Break, Bears Defend the Zone
BNB’s chart highlights a clear pattern: every time price has approached this trendline, sellers have stepped in. The current push into resistance is happening after a compressed recovery, and multiple historical rejections emphasize how aggressively bears protect this region.
The 50-day SMA at $1,017.25 remains well above spot price, reinforcing the broader downtrend. Meanwhile, the 200-day SMA at $835.56 sits below current price, creating a tight zone of conflict between medium-term pressure and long-term support.
The RSI sits at 43.37, neutral but leaning toward weakness, showing that buyers have not regained full momentum.
If bulls fail to break through the intersection point of the resistance cluster, BNB could rotate back downward and revisit the highlighted target zone on the chart.
BNB Short-Term Price Action Shows Reduced Strength
Latest intraday data from TradingView shows BNB fluctuating between $885–$900, with a fading push from yesterday’s sharp rebound. The sharp spike toward $905 lost steam quickly, and the market is now forming lower highs on the 5-minute chart, a sign that buyers are tiring into resistance.
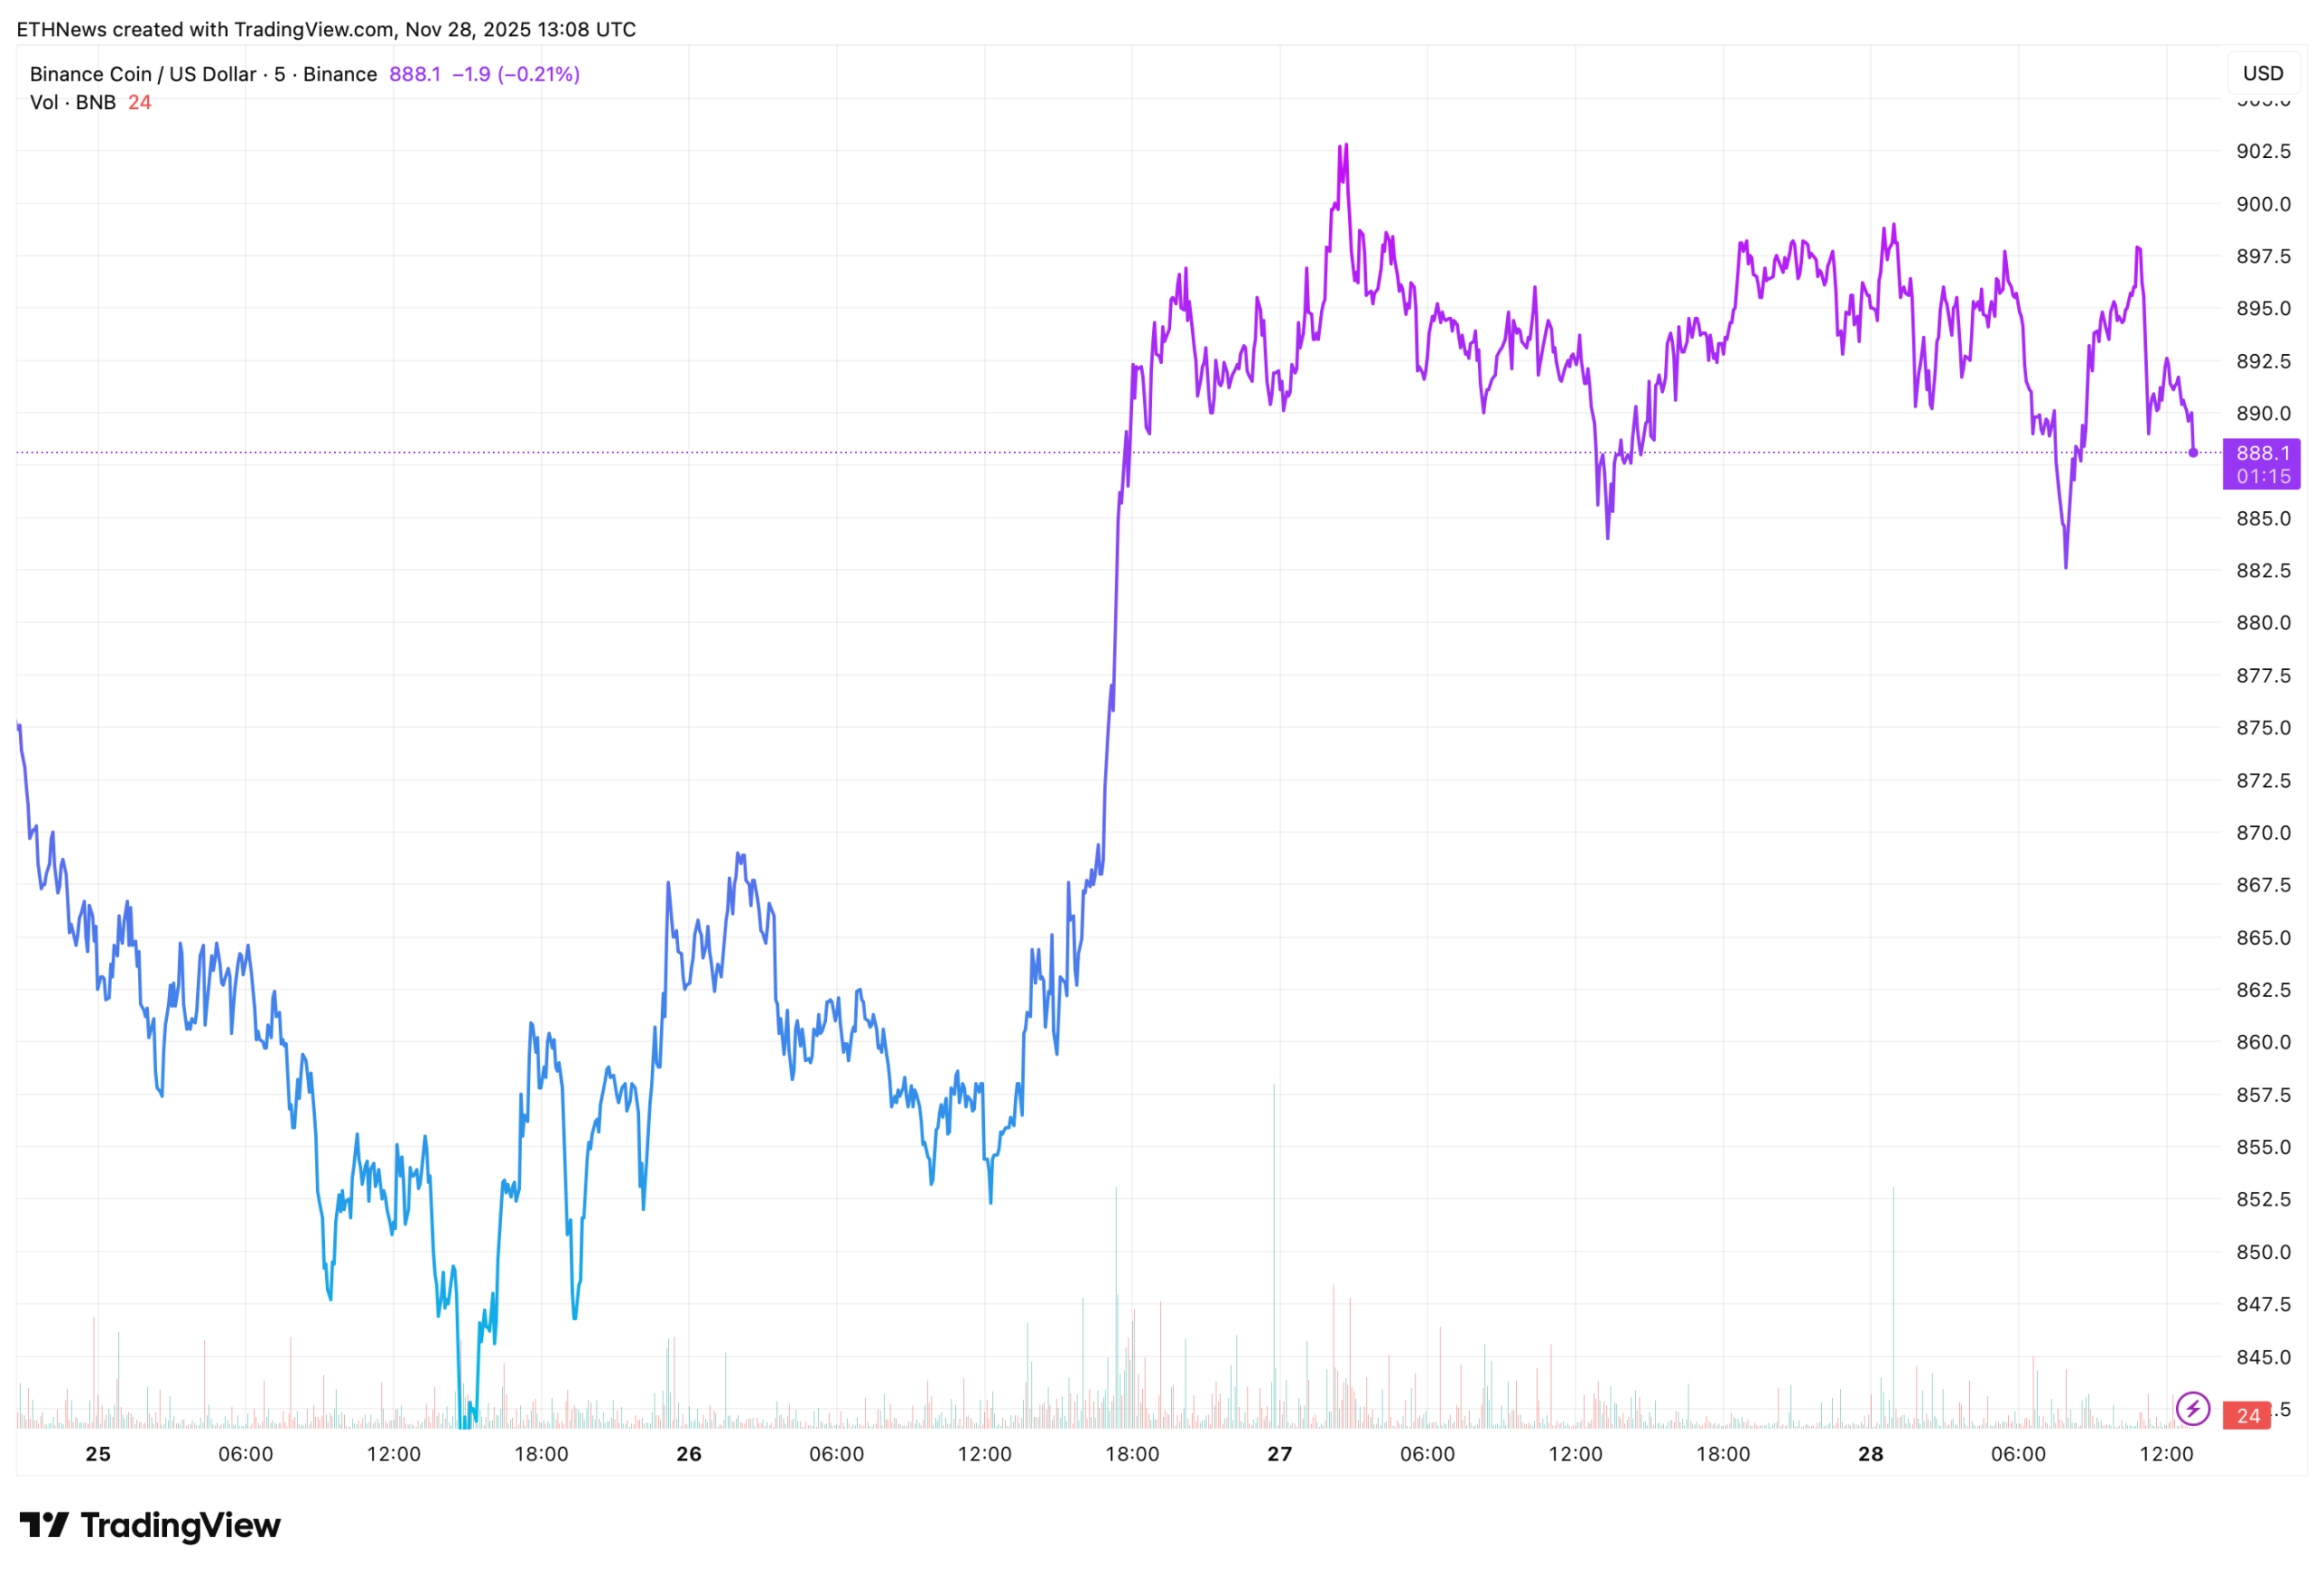
Volume remains low at 24, confirming a lack of conviction behind the latest bounce.
Unless a strong breakout emerges, the price is vulnerable to another leg down as outlined in the chart structure.
Critical Breakdown
Bullish Case (Needs Validation)
- •Price must break and close above the long-term trendline.
- •RSI must push above 50 with rising volume.
- •Breakout would invalidate the bearish structure and open upside toward the $950–$1,000 region.
Bearish Case (Currently Favored)
- •Another rejection at resistance sends BNB back to the $820–$780 target zone.
- •Long-term downtrend remains intact as long as BNB trades below the trendline.
- •Extreme fear conditions amplify downside risk.
If BNB fails this test, the next bearish extension becomes increasingly likely.