

BNB traders monitor $853, $660, and $564 as major on-chain support zones during increased derivatives activity. A sharp rise in options volume reflects heavier hedging as futures open interest weakens slightly. Long and short positioning diverges across exchanges, adding mixed signals to BNB’s near-term direction.
BNB trades through a volatile session as new on-chain data and derivatives metrics show shifting trader behavior and defined support zones that could guide the asset’s next move.
BNB Support Levels Form a Layered Structure
BNB remains influenced by three core support levels identified through realized distribution. According to the URPD chart shared by Ali (@ali_charts), the largest concentration sits at $853. This area holds the strongest supply cluster and reflects extensive historical movement on-chain.
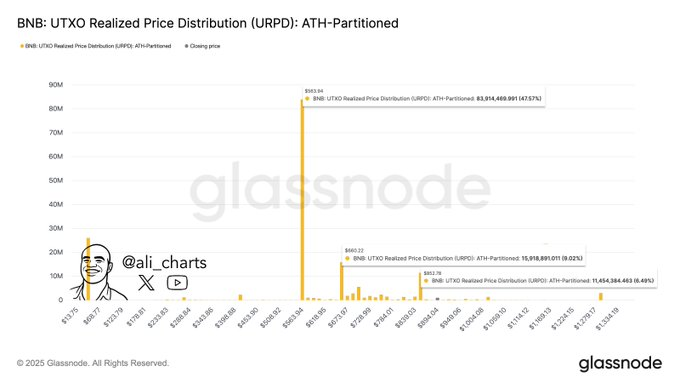
The structure then moves toward the $660 zone, which carries a mid-range pocket of realized activity. This region sits between older accumulation phases and higher cost-basis commitments. Market participants often revisit such regions during corrective phases.
A deeper level stands at $564, marking an earlier accumulation zone. While smaller than the upper ranges, this realized pocket still carries enough weight to slow price movement if tested. Combined, these zones form a staircase pattern defining BNB’s broader structure.
Derivatives Data Shows Heightened Market Activity
As of writing, derivatives data places BNB at $820.4 after a daily drop of 9.04 percent. The move follows a futures volume of $5.32 billion and spot activity of $605.28 million, creating a market driven heavily by leverage.
Open interest sits at $1.38 billion after a slight reduction. This shift suggests traders trimmed exposure amid rapid price swings. Options markets expanded sharply as volume climbed 139.10 percent and open interest increased 20.69 percent, pointing to broader hedging behavior.
Long and short positioning varies by platform. The overall long-to-short ratio of 0.9066 shows more short exposure. Yet Binance accounts hold a strong long bias, and OKX presents a similar pattern. Top trader positions remain more balanced, suggesting reduced directional conviction.
Liquidation Patterns Reveal Uneven Trader Exposure
Short-term liquidation data shows modest losses, with $70.87K cleared in the past hour. Most came from short positions, reflecting brief upward movements during intraday volatility.

Across longer periods, the trend shifts. Over 12 hours, short liquidations reached $123.76K. Over 24 hours, long traders absorbed heavier losses at $8.52 million, reflecting the broader decline that caught late buyers.
Activity on Binance, OKX, Bybit, and Bitfinex continues to dominate derivatives flow. These platforms maintain the highest levels of leveraged exposure, aligning with the ongoing rise in intraday volatility.