

Technical Outlook for BNB
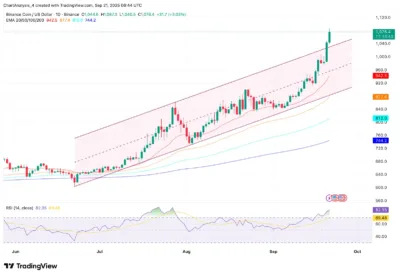
The daily chart reflects a strong bullish structure for BNB. The price has now broken the upper boundary of its ascending channel, a move that has been fueled by significant buying pressure. The 20-day exponential moving average (EMA) at $942 and the 50-day EMA at $877 are both acting as trend support, providing solid foundations for the upward momentum. Even though the Relative Strength Index (RSI) has reached 82, signaling overbought conditions, the bullish trend remains intact as long as BNB stays above key support levels.
On-Chain Data Supporting BNB’s Bullish Move
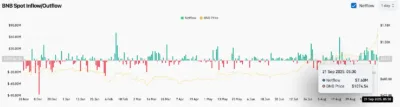
On-chain data reinforces the optimism surrounding BNB’s price movement. There was a $7.6 million net inflow into exchanges recently, reflecting continued investor confidence despite the price increase. These inflows suggest that both retail and institutional investors are positioning themselves for higher prices. Additionally, the contract holdings for BNB have surged to 2.34 million tokens, marking an all-time high. This shows strong institutional participation in both derivatives and spot markets, reinforcing the positive market sentiment.
BNB Price Targets and Support Levels for September 22
Looking ahead to September 22, BNB’s price will likely face resistance around the $1,080–$1,100 zone. If it manages to break above $1,080, the next targets could be $1,125 and $1,150. On the downside, the price may pull back toward $1,040, with stronger support at $960, where the 20-day EMA is positioned. Losing the $877 support would expose BNB to a deeper retracement toward the $812 level.
The short-term outlook for BNB remains positive as long as it holds above critical support levels. A breakout past $1,100 would signal further bullish continuation, while a failure to maintain support could prompt a return to earlier price ranges.