

Key Market Indicators
- •$233 million in liquidable positions pose a risk to Bitcoin's stability as short traders increasingly occupy upper price levels.
- •A significant buy wall at $94,000 represents the last major support level before a potential deeper downside opens.
- •Bitcoin's performance now trails U.S. Treasuries, indicating a market shift towards safer assets over cryptocurrency volatility.
Bitcoin was trading near $96,367 following a week of sustained downside pressure. The market is exhibiting growing caution due to rising liquidation risks, with traders positioning themselves for potential volatility.
Updated data indicates that $233 million in Bitcoin positions are at risk of liquidation. This figure highlights a buildup in leverage, particularly on the short side, which could lead to sharp price movements if the market direction changes.
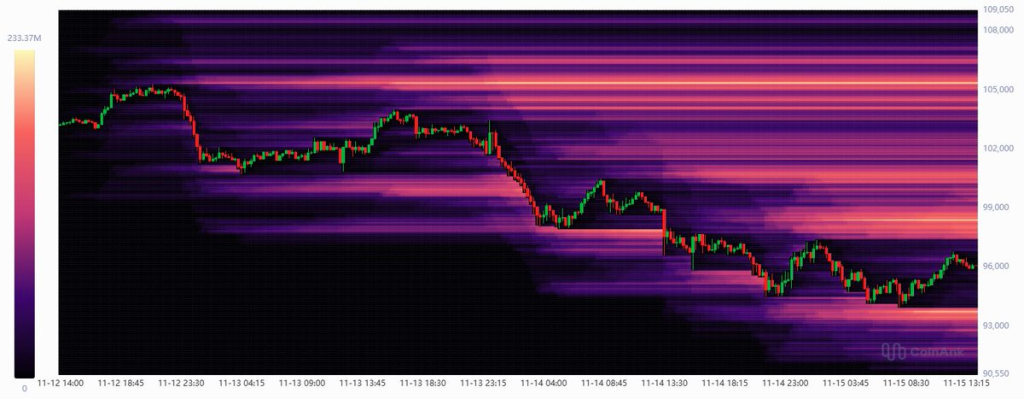
Market Sentiment and Liquidation Heatmap
A liquidation heatmap reveals a concentration of short positions between $102,000 and $108,000. These zones are considered high-risk areas where short sellers may be compelled to close their positions if prices begin to rise.
As one observer noted, "Most high leverage positions are short positions." This concentration of short positions above current price levels increases the likelihood of a short squeeze if buyers enter the market. Conversely, the lower density of liquidations below the current price suggests that most long positions have already been cleared, making the downside less crowded.
Support and Resistance Levels
On lower timeframes, Bitcoin approached a strong demand zone at $94,000. An analyst posted, "$BTC almost touched the 94k buy wall." This area is characterized by prior volume spikes and buying interest, serving as the nearest significant support level.
If this level holds, it could trigger a short-term rebound. However, resistance remains substantial between $104K and $112K, where short liquidations could begin to take effect. This range may limit any upward recovery unless buying momentum becomes firmly established.
Bitcoin's Performance Relative to U.S. Treasuries
Recent performance charts indicate that Bitcoin has underperformed U.S. Treasuries over the past year. As of November 17, Bitcoin has seen a decline of 2.6%, while TLT, a long-duration Treasury ETF, has increased by 2.6%.
This trend suggests a growing investor preference for low-risk assets. A recent post highlighted this shift, stating, "Bitcoin is now underperforming U.S. Treasuries," underscoring changes in risk sentiment. This reversal from earlier in the year reflects pressure from macroeconomic conditions and tighter liquidity across financial markets.