

Key Insights
- •Bitcoin (BTC) is facing significant resistance around the $107,000 mark, with the potential for a short-term correction towards key support levels.
- •The crucial support zone between $100,000 and $104,000 must hold to prevent a deeper pullback within the current BTC cycle.
- •The 300-Day Simple Moving Average (SMA) continues to act as active support, and traders are closely monitoring for either a breakout or breakdown from the current trading range.
Price Stalls Near $107K Resistance
Bitcoin (BTC) was trading at $103,621, experiencing a 1.7% decrease over the past 24 hours. Despite this recent dip, BTC has shown a slight gain over the past week. The price recently tested a significant resistance zone near $107,309, which has increased the potential for a short-term market reaction.
Bitcoin reached the 50% Fibonacci retracement level, approximately $107,309, a level frequently observed for price reactions. According to analysis from More Crypto Online, this move is being tracked as either a corrective B-wave or wave 4. Following this test, BTC has since pulled back slightly and is currently trading near the $105,000 mark.
The area around $107,000 has historically paused upward momentum, and current price action indicates hesitation. The outcome of this phase, whether it leads to a deeper retracement or continuation, will depend on the price action in the upcoming trading sessions.
Key Support Range Holds Short-Term Outlook
The primary support zone for Bitcoin is situated between $100,667 and $104,111. This range encompasses the 38.2%, 50%, and 61.8% Fibonacci retracement levels. More Crypto Online noted the importance of this area, stating, "Price should ideally stay above 100,667 USD" for the current bullish setup to remain valid.
Should the price dip into this support area, it is expected to attract renewed buying interest. Conversely, a decisive break below the $100,667 level would significantly weaken the current technical pattern and increase the probability of a more substantial correction.
Buyers React at 300-Day SMA
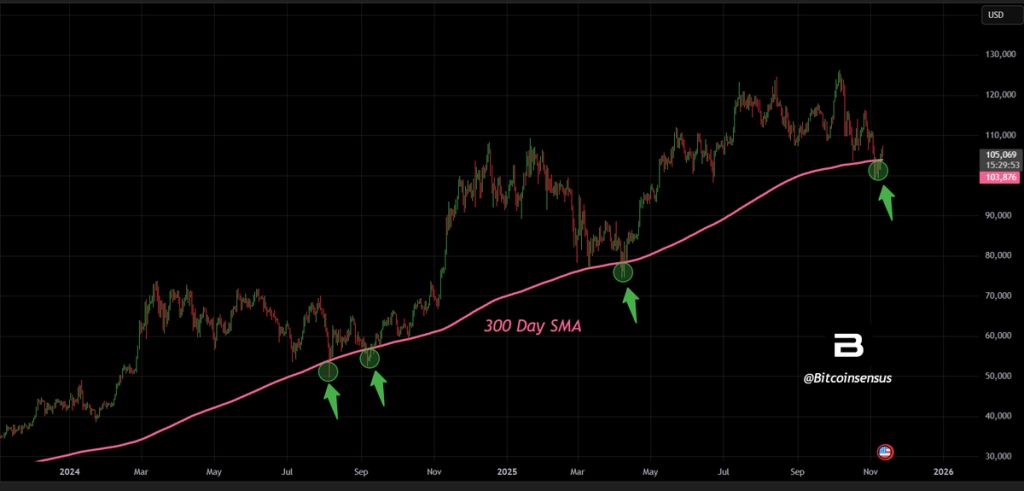
Bitcoinsensus highlighted that Bitcoin is currently testing the 300-Day Simple Moving Average (SMA). This particular level has historically served as a reliable support throughout the current cycle, with previous dips below it often being followed by sharp and swift recoveries.
The analysis from Bitcoinsensus indicated, "We’ve seen multiple fakeouts below it before strong recoveries." The recent price spike observed on the chart suggests a potential resurgence of interest from traders who are closely watching this significant moving average. The chart displays a sudden upward movement after a prolonged period of low volatility.
Outlook Hinges on Short-Term Reactions
With Bitcoin having tested its resistance levels and key support zones clearly defined, market participants are now looking for confirmation signals. A clear and sustained break above the $107,309 resistance level could indicate building strength and a potential continuation of the upward trend. However, a failure to hold the support near $100,667 would likely shift market sentiment and expectations towards a more bearish outlook.