

Cardano's Current Market Position
Cardano continues to move through a broad corrective phase marked by weakening momentum and limited confirmation signals. Current conditions show deep retracement behavior, restrained derivatives activity, and a market waiting for stronger structural evidence before defining a decisive trend shift.
ADA remains inside a broad corrective zone with no confirmed long-term low. Derivatives show reduced speculation as open interest rises amid mixed liquidations. Funding stays mildly negative, reflecting a controlled but persistent bearish tone.
ADA Trades Within a Broad Corrective Structure
Cardano is trading within a complex B-wave retracement as described by the analyst More Crypto Online. The broader support region sits between the 61.8% and 78.6% Fibonacci retracements at $0.437 to $0.322. Price action inside this zone often develops during extended corrective phases.
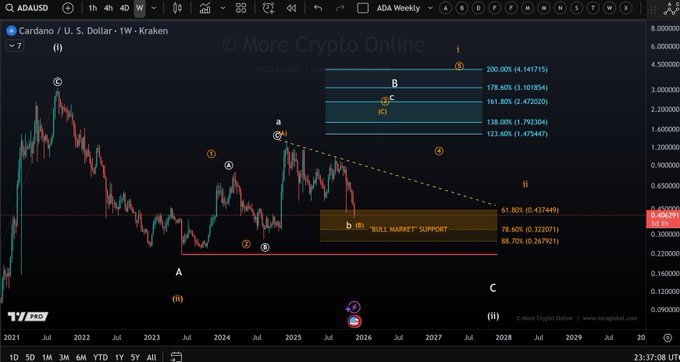
The chart still lacks evidence of a confirmed low. There is no clear five-wave advance to validate a trend shift, and the descending dotted trendline shows ongoing pressure. ADA is showing a 4.20% profit in 24 hours but a loss of 17.19% in the week at the prevailing price of $0.4133.
In the event that ADA falls below 78.6% retracement, the analysis shows the subsequent levels, which are at $0.267 and the June 2023 low of $0.215. These regions form the final layers of support within a deep B-wave formation before the larger structure requires reassessment.
Derivatives Activity Shows Cautious Market Behavior
The derivatives dashboard shows declining speculative engagement as trading volume drops 41.05% and options volume falls over 92%. This reflects reduced short-term positioning and restrained appetite for aggressive strategies during ADA’s extended decline.
Despite weaker activity, open interest has risen 2.78%. This implies traders continue to hold or slowly add to positions rather than exit entirely. Long-side bias appears strongest among higher-volume participants, with Binance top-trader accounts showing a 2.6887 long/short ratio.
Liquidation patterns indicate mixed but slightly upward-leaning pressure. Total liquidations reached $435.05K in the past day, with shorts producing $258.03K. Long liquidations at $177.02K show that trading remains choppy, and both sides face abrupt swings.
Funding Trends Reflect Subdued Bullish Participation
The OI-weighted funding rate chart shows muted sentiment from August through mid-November. Funding hovered around zero, reflecting balanced positioning and cautious traders avoiding extended leverage. Neutral to slightly negative readings dominated this period.

A sharp capitulation event occurred on October 11 when funding dropped deeply negative. This coincided with a steep price breakdown, suggesting a short-heavy reaction supported by leveraged activity. Afterward, funding normalized quickly, forming a brief anomaly rather than a durable shift.
Since then, funding has drifted slightly negative as ADA slid toward the $0.35–$0.40 range. This shows a controlled downtrend shaped more by reduced demand than overwhelming short pressure. Until funding turns sustainably positive, ADA remains in a structurally weak phase.