

Key Observations on Chainlink's Market Position
- •Chainlink is forming a recurring continuation pattern that closely resembles a previous structural setup that preceded a significant breakout.
- •The market behavior of LINK collectors aligns with chart structures indicating renewed compression following a strong upward impulse.
- •Short-term price movements demonstrate steady liquidity, with LINK trading near $14.07 and exhibiting healthy volume flows.
Chainlink is currently trading within a stable range. Technical structures across multiple charts suggest a period of renewed compression, which typically indicates that the market is preparing for another expansion phase. Recent activity reflects both short-term stability and consistency in long-term structural formations.
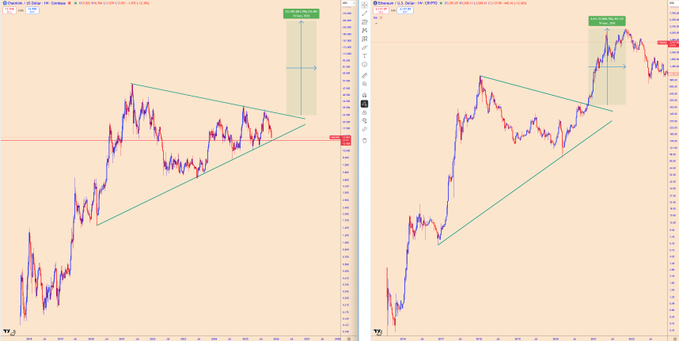
Structural Patterns Suggest a Familiar Continuation Setup
Chainlink's current chart displays a symmetrical structure that has developed after a period of broad price movement. This formation is characterized by higher lows converging with lower highs, creating a distinct compression zone. Traders often interpret this type of contraction as a maturing phase where liquidity becomes stable before a decisive price move.
The horizontal level situated near the midpoint of this formation serves as a balance region. Market activity has repeatedly returned to this zone as both buyers and sellers reassess their positions. This consistent interaction has contributed to the coiling effect that is visible at the center of the pattern.
A comparable structure observed on a previous chart is playing a significant role in shaping market expectations. That earlier formation ultimately broke upward with considerable force once the compression reached its final stage. The consistency between these two formations is shaping the current discussion regarding Chainlink's broader price trajectory.
Market Narrative Expands with Community Commentary
A recent post from ⬡ LINK Collector ⬡ provides additional context to the ongoing discussion about long-term positioning. The collector stated, “$LINK at $250 is inevitable and the foundation for $1,000 LINK is being built,” drawing a connection between the observed structural behavior and the potential for extended-range price appreciation. These comments are consistent with the recurring pattern that has been identified on both charts.
The observation that Chainlink has completed a similar structure in the past offers traders a valuable reference point. When the earlier compression phase resolved, the price advanced through its measured projection, which has reinforced confidence in the pattern's relevance. This historical behavior influences how analysts are currently viewing the present compression phase.
Community discussions are also addressing Chainlink's role within institutional development. LINK Collector has mentioned the protocol's involvement in advisory activities and infrastructure planning, adding another dimension to the market's evaluation of whether long-term adoption is being reflected in current price behavior.
Short-Term Stability Appears as Trading Volume Remains Strong
Chainlink was trading around $14.07 at the time of writing, representing a slight decline over the preceding 24 hours. The price fluctuation between $13.71 and $14.45 has been controlled, indicating it is not a result of unfocused selling. Price swings have remained contained and have consistently reverted to a central region, signaling stable market participation.
The market capitalization stands near $9.8 billion, supported by a circulating supply of approximately 696.8 million LINK. The fully diluted valuation, which is near $14 billion, confirms that a substantial portion of the supply is already active, which reduces the pressure from future distribution. This market structure supports a consistent trading environment.
The trading volume, which is near $925 million, indicates strong engagement during this period. The fact that the price has moved both up and down within the day, specifically between $13.80 and $14.30, suggests active positioning rather than market withdrawal. The pattern of quick recoveries following downward wicks points to firm demand near the lower price boundaries.