

The cryptocurrency market is currently experiencing a lack of direction, creating uncertainty for investors. This could lead to even lower volatility and thin liquidity, where any selling pressure might push the market into a state of limbo.
XRP Faces Significant Challenges
There is limited room for optimism on the XRP chart, with the asset barely holding onto the $2 level. The descending channel that has been forming since early October, characterized by lower highs and lower lows, remains intact. Every attempt to break above resistance has been immediately rejected, and the most recent pullback from the mid-channel region confirms that sellers are still in control.
The market sentiment for XRP is not confused but rather tired, illiquid, and biased towards the downside. The manner of XRP's decline, rather than the magnitude itself, is the primary concern. The price continues to retreat from the 20- and 50-day Exponential Moving Averages (EMAs) as if they are insurmountable barriers. Momentum rarely sustains for more than a few candles, and trading volume on positive days is significantly lower compared to the heavy sell-offs observed during each breakdown.
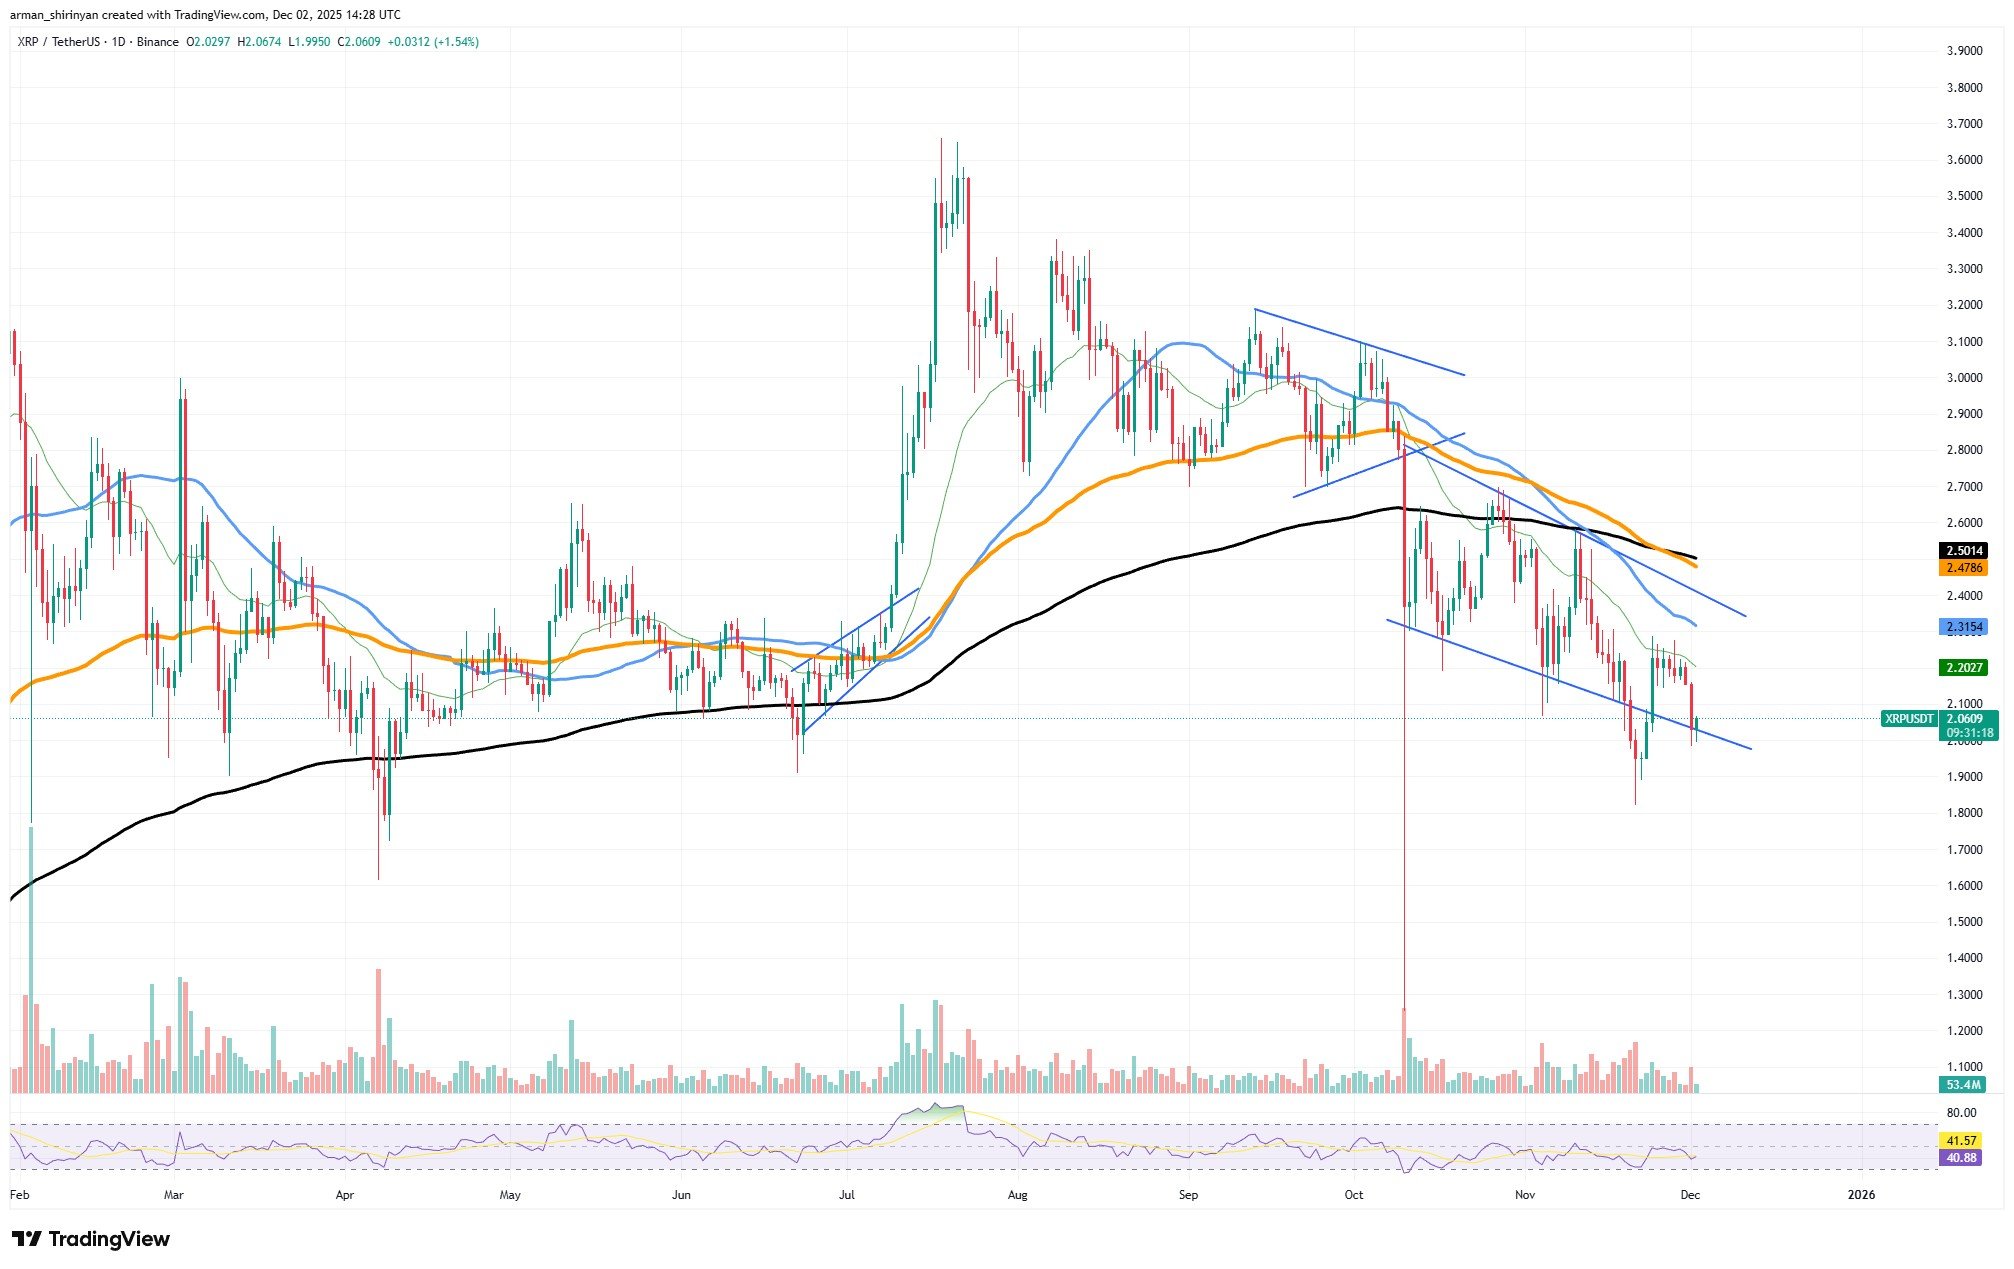
This behavior is indicative of a classic continuation pattern, not a consolidation or accumulation zone, nor even a meaningful pause. A break below $2 logically opens the path to the next liquidity pocket around $1.85-$1.90. If the descending channel breaks again, similar to the panic wick seen in November, a more significant decline could occur.
Currently, there are no indicators on the chart suggesting an impending uptrend. The Relative Strength Index (RSI) is hovering around the mid-40s, but without divergence or a trend shift, this reading represents neutral noise. The 200-day EMA is positioned far above the current price, and the 50/100 EMA "mini-death cross" continues to exert downward pressure on the asset.
Historically, XRP tends to bottom out after periods of capitulation rather than controlled selling. However, the current market conditions do not exhibit such exhaustion. Therefore, the next downward movement is not only possible but appears to be the most coherent outcome based on the current structure and momentum. Furthermore, there is no indication of improvement unless XRP experiences an unusual surge in demand. Buyers are not actively participating, and the chart reflects this reality starkly.
Bitcoin Shows Potential for Recovery
Bitcoin's current chart structure is complex but not without hope. After a sharp decline in mid-November, the price eventually found buyers in the mid-$80,000s, initiating a clear recovery. While this recovery is sufficient to potentially push the price towards $90,000, it is not strong enough to signal a definitive trend reversal.
The shape of the bounce is a key indicator. Bitcoin printed a classic exhaustion wick near its local bottom, followed by a series of higher lows on increasing volume, suggesting that buying interest has not disappeared. A significant factor is the gap between the spot price and the 20-day EMA.
Another structural element is the extremely oversold RSI reading recorded in November, which Bitcoin typically resolves with a relief rally. In similar past instances where momentum reset so dramatically, the price recovered sufficiently to test significant resistance levels. This dynamic could repeat itself now.
However, the area above $90,000 presents considerable resistance. The zone between $92,000 and $96,000 is where the 50-day EMA, the previous breakdown area, and a cluster of failed support levels from October converge. Without a shift in macroeconomic sentiment or a substantial increase in demand, this area is likely to act as a strong barrier.
Therefore, reaching $90,000 is a plausible outcome, fitting the pattern of an oversold bounce testing the underside of broken support. However, expecting anything beyond this, especially a sustained breakout, does not align with the current market posture. Bitcoin remains below its 200-day EMA, continues to print lower highs, and lacks the aggressive buying activity characteristic of trend shifts.
Dogecoin's Stabilization Faces Risks
Dogecoin is attempting to stabilize, but it would be premature to declare the end of its downtrend. The chart remains within a clear, well-defined descending structure, with most bounces being immediately met with selling pressure. The recent upward movement, a rebound from the $0.13 to $0.14 zone, appears to be more of a technical relief than a genuine shift in market sentiment.
The price is still trading below the 20-day, 50-day, and 200-day EMAs. These averages are aligned in a classic bearish pattern, all pointing downwards. Such an alignment typically does not resolve quickly, indicating that traders are still in control.
A critical level to monitor is between $0.155 and $0.16. Dogecoin has encountered repeated rejections in this area, which also represents the midpoint resistance of the most recent decline. If buyers cannot reclaim this zone, any discussion of a trend reversal would be unfounded. Breaking above this level would at least suggest that sellers are losing their grip, marking the initial step towards a potential bullish trend, though not necessarily confirming one immediately.
A significant external factor influencing Dogecoin is Bitcoin's performance. DOGE does not operate independently in the current market conditions. Bitcoin is still entrenched in its own downtrend, and any failed bounces in BTC directly impact assets like DOGE. Meme coins tend to remain suppressed if Bitcoin continues to decline or even consolidates sideways against significant resistance.
Consequently, the question of whether the DOGE downtrend is ending remains unconfirmed by the chart. Investors should anticipate continued sideways or downward movement unless Bitcoin exhibits a substantial recovery. Without broader market strength, Dogecoin is likely to continue its drift, with any short-term bounces proving to be temporary rather than indicative of reversals. Liquidity drains rapidly, and speculative appetite evaporates, creating an environment where DOGE typically performs poorly.