

Crypto markets are currently experiencing a mid-cycle bull correction, characterized by rising stablecoin supply, stabilizing ETF assets under management (AUM), and the VIX "fear index" hovering between 15 and 20. This suggests that on-chain capital is not exiting the ecosystem but is waiting on the sidelines for clearer market signals before re-entering risk assets. The sharp drop in ETF AUM after October 8th, followed by a slow recovery, indicates that the correction originated in traditional finance, reflecting institutional capital's cautious stance. The VIX remaining between 15 and 20 signals uncertainty rather than a crisis, supporting the view that current volatility is a mid-cycle reset rather than a true bear market.
Market Thesis: This is Not a Real Bear Market
The current market environment does not qualify as a crypto bear market. Instead, it appears to be a mid-cycle reset within a broader bull market. This phase is characterized by aggressive shake-outs, forced deleveraging, and position rotation, rather than a structural collapse. The market is undergoing a change of hands, not signaling its demise.
This conclusion is based on cross-referencing three sets of mid-term indicators: stablecoin market cap, spot Bitcoin ETF AUM, and the VIX "fear index." Stablecoin supply indicates whether on-chain capital is exiting the market or waiting on the sidelines. ETF AUM reveals the behavior of traditional finance regarding Bitcoin exposure. The VIX provides insight into global risk appetite through US equities, which still influence crypto markets.
While stablecoins and ETF AUM have been analyzed previously, this discussion focuses on the VIX and then integrates all three indicators to determine the current market regime.
What VIX Actually Measures
The VIX, often referred to as the fear index, is derived from S&P 500 options and reflects the market's implied volatility expectations over the next 30 days. It is a forward-looking measure, representing the market's collective forecast of future turbulence in US stocks.
Crypto markets are relevant to the VIX because Bitcoin and the broader crypto market often exhibit a strong risk-on correlation with US equities, particularly growth and tech stocks. When US risk assets de-risk, crypto markets typically experience pressure as well. Consequently, some traders use the VIX as an inverse indicator for Bitcoin; elevated fear in stocks often correlates with pressure on risk assets, while a falling VIX tends to coincide with sustained bull environments.
Macro traders commonly observe several VIX zones:
- •Below 15: Indicates strong risk-on conditions, typically associated with bull markets.
- •15–20: Suggests choppy, indecisive market conditions, searching for direction.
- •20–25: Implies markets are heavy, and risk appetite is fading.
- •Above 25: Signals stress or outright bear-market behavior.
These ranges serve as general guidelines rather than a precise trading system, as the VIX can experience rapid and significant fluctuations. Its value is more meaningful as a mid-term indicator of market regime rather than a short-term timing tool.
Testing VIX Against Recent BTC Moves
Examining the VIX's behavior around significant Bitcoin price movements reveals its inverse relationship with BTC. When the VIX rises from the low teens towards the mid-20s, Bitcoin tends to decline. Conversely, when the VIX falls towards calmer levels, BTC often experiences upward momentum. This inverse pattern is noticeable around key inflection dates.

However, the VIX's utility as a short-term timing tool has limitations. Before the sharp BTC drop around October 8th, the VIX showed a gradual increase, hinting at nervousness in equity markets, but the move was not sufficiently dramatic to be an obvious red flag in real-time.
Similarly, around the new down-leg that began near November 10th, Bitcoin turned lower first, with the VIX only picking up a few days later, around November 13th. While there was one instance where VIX moved in sync with BTC, the broader pattern suggests that VIX functions better as a mid-term regime gauge than a precise short-term timing tool, often lagging price action.
The key takeaway is not to trade Bitcoin based on every VIX fluctuation. A more realistic conclusion is that sustained VIX levels above 25 indicate a bear market environment, while ranges between the mid-teens and around 20 suggest corrections and choppiness within a broader bull market.
Bear Market vs. Bull Correction Through the Lens of VIX
The VIX's behavior across different market cycles provides a clear distinction between bear markets and bull-market pullbacks.
During 2022, a textbook bear phase for both equities and crypto, the VIX spent most of its time above 25, with frequent spikes and difficulty staying below 20. This sustained period of high fear and stress is characteristic of a bear market.
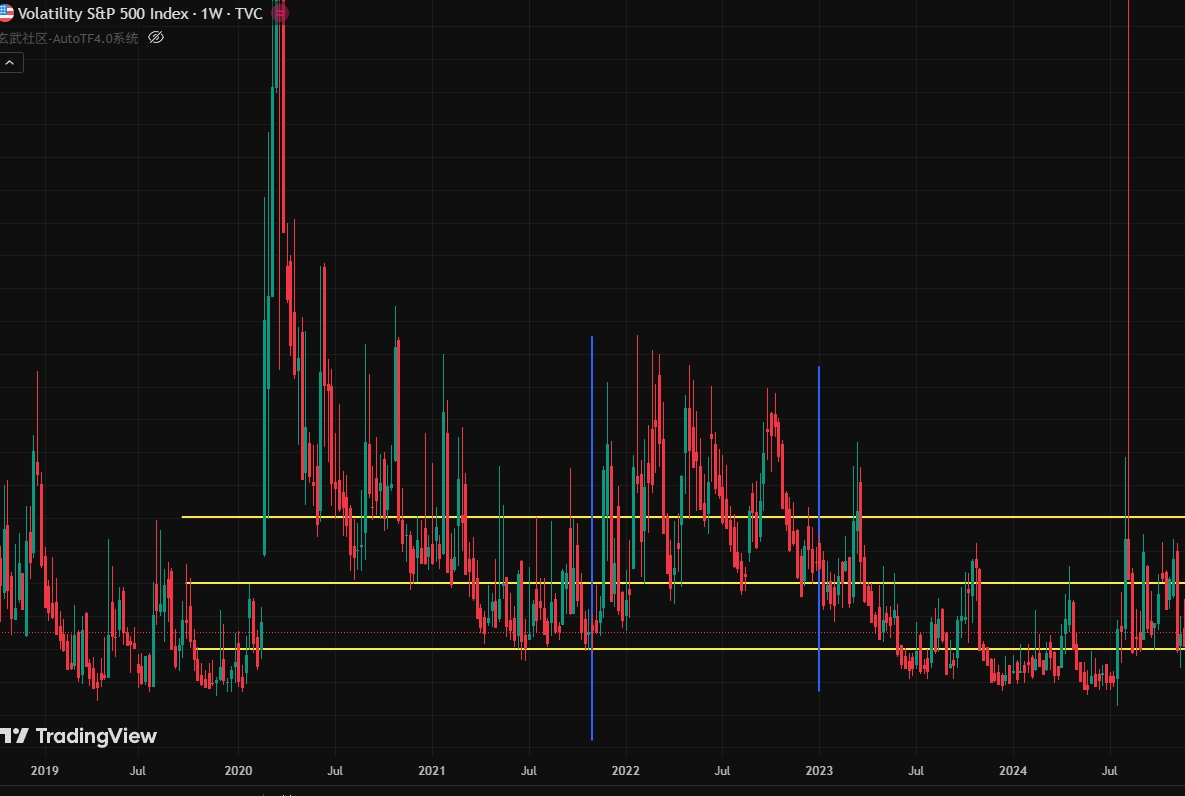
In contrast, the current market backdrop shows the VIX oscillating within the 15–20 band, with several dips below 17.5 since November 25th. These levels are not indicative of full-blown bear market conditions but rather a cautious market environment without panic.
During a strong bull phase earlier in the year, the VIX declined from elevated levels near 50 towards the mid-teens between approximately April and October. The first significant touch of the 25 line occurred in April, coinciding with Bitcoin chopping near local lows. As the VIX continued to decline, BTC initiated its largest bull leg of the year.
This contrast is significant: a true bear market sees VIX consistently above 25, while a powerful bull market features VIX trending towards or below 15. The current situation, with VIX in the 15–20 zone, aligns with a mid-cycle reset – a period of discomfort and consolidation rather than euphoria or despair.
Stablecoin Supply: Dry Powder, Not Escape Capital
The stablecoin market cap continues to rise, recently reaching new highs around $268.9 billion. This indicates that on-chain capital is remaining within the crypto ecosystem, rather than exiting entirely. Participants are adopting a "sit and watch" mode, holding stablecoins like USDT and USDC, and waiting for more favorable entry points. This behavior is distinct from the mass exodus seen in a true bear market.
The sustained upward trend in stablecoin supply signifies that the ecosystem still possesses capital, even during periods of price drawdowns. The issue is not a lack of funds but a temporary risk-off stance and increased patience among participants.
This dynamic explains why painful price drawdowns can occur without signaling a structural market top. As long as stablecoin supply continues to trend upwards, the market retains ammunition for future rallies.
ETF AUM: Where Traditional Money is Hiding
Spot Bitcoin ETF AUM serves as a barometer for traditional finance's involvement in Bitcoin. Following the outflows around October 8th, ETF holdings showed a clear and sharp decline, indicating that traditional investors were reducing their exposure. By November 25th, AUM reached a recent local low, followed by a modest and hesitant recovery.
This trend suggests that the current correction is primarily driven by traditional finance de-risking, rather than capitulation from long-time on-chain participants. Spot ETF flows remain a key channel for large, regulated capital pools to express their views on Bitcoin, and negative flows directly impact price.
Despite the outflows, the AUM has not experienced panic liquidation or structural collapse, but rather a drawdown followed by a fragile attempt at rebuilding. This observation aligns with the VIX signal of market nervousness without outright panic.
Pulling the Mid-Term Indicators Together
When considered together, the three mid-term indicators present a coherent picture of the current market.
The VIX is oscillating in the 15–20 band, signaling uncertainty but not crisis. Stablecoin market cap is at a fresh high of approximately $268.9 billion, indicating that capital remains in the crypto arena, primarily held in stablecoins and awaiting opportunities. ETF AUM, after a notable drop post-October 8th and a low around November 25th, is showing signs of stabilization with a weak recovery.
This combination suggests that on-chain money has not left the market, off-chain money has trimmed its risk exposure, and equity markets are cautious rather than terrified. This scenario is distinctly different from a full bear market and points towards a bull-market correction driven by traditional outflows and macro uncertainty.
In such an environment, forcing trades with unclear market direction is a common way to incur losses. While being long risk is rational in a bull market and short or under-exposed in a bear market, the current mid-zone calls for patience, capital preservation, and waiting for improved odds rather than assuming every bounce or dip represents a definitive top or bottom.
The market may undergo consolidation phases that are longer and more frustrating than anticipated. Historical patterns, such as roughly two months of price decline followed by a month of sideways choppiness before a major signal emerges, can serve as a reminder, though market symmetry cannot be guaranteed.
What to Watch Next: Macro and Long-Term Signals
The current mid-term indicators do not exist in isolation. The primary driver of this correction appears to be within traditional finance, stemming from concerns about growth, liquidity, and the future path of interest rates. Spot ETF outflows and equity de-risking are symptomatic of this deeper macro narrative.
Therefore, upcoming interest-rate decisions will be crucial. These decisions will not only impact bonds but also reshape expectations for real yields, dollar liquidity, and overall risk appetite. By overlaying these macro factors with long-term indicators such as real rates, balance-sheet trends, and structural liquidity measures, a clearer perspective on the bull market's position within the larger cycle will emerge.
For the present, the mid-term indicators suggest that this is a bull market undergoing a reset, not a market in terminal decline. Stablecoin supply continues to climb, VIX remains in the middle zone, and ETF AUM is stabilizing after a period of decline. Until there is a decisive improvement in macro data or a clear surge in fear, a rational approach involves patience: observe, prepare, and allow the next set of signals to develop before making significant market commitments.