

Bitcoin (BTC) has recently formed a death cross, a technical indicator where its short-term moving average falls below its long-term moving average. This pattern historically suggests a potential shift in price direction. While similar patterns over the past year have preceded local bottoms, the death cross in 2022 was a precursor to a significant bear market.
Bitcoin Price Declines Below $90,000 Amidst Trend Shift
At the time of reporting, Bitcoin is trading around $90,500, marking a nearly 6% decrease in the last 24 hours and a 15% drop over the past week. This downturn places Bitcoin approximately 30% below its all-time high of over $126,000, which was established on October 6, 2025. The recent breach below the 50-day and 200-day moving averages has now completed the death cross pattern on the price chart.
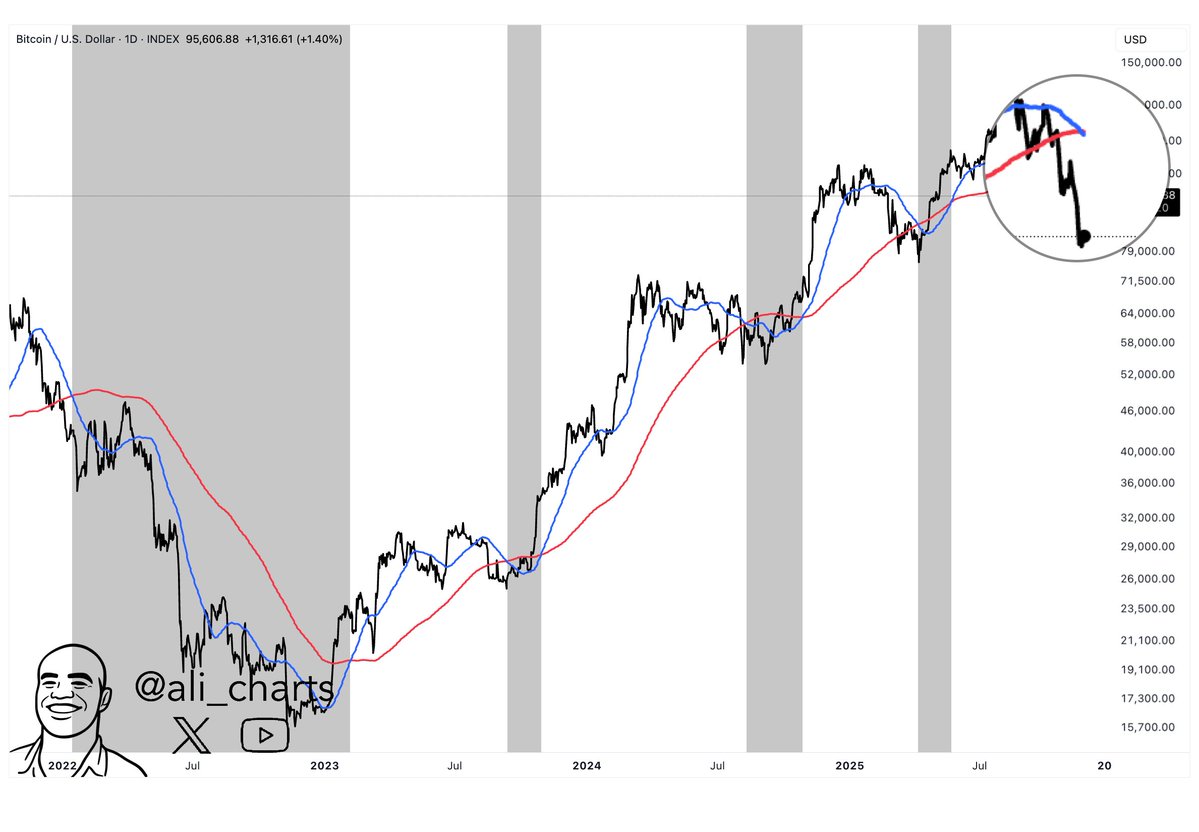
According to analyst Ali Martinez, while every death cross observed in the past year has been followed by a recovery, the pattern in 2022 led to an extended market decline. The current pattern and the speed of Bitcoin's recent drop bear a resemblance to the 2022 scenario.
Market participants will be closely observing whether current support levels can hold or if the decline will continue. If the current market behavior mirrors the 2022 structure, a prolonged downtrend could be a possibility.
Furthermore, Bitcoin has fallen below the MVRV mean price of $98,650. The MVRV model assesses valuation zones by tracking the difference between market value and realized value. A price drop below the mean often indicates a move into undervalued territory. On November 16, Bitcoin was trading at $94,390, situated below the model's neutral zone.
Below $98,650, the next key Bitcoin $BTC levels are:
• $75,740
• $56,160
• $52,820 pic.twitter.com/gMmWIUZ0nY— Ali (@ali_charts) November 17, 2025
Martinez has identified three potential lower price targets to watch if the downward trend persists: $75,740, $56,160, and $52,820. These levels correspond to the model's -0.5 deviation, realized price, and -1.0 deviation, respectively, and have historically been associated with market bottoms. A failure to reclaim the $98,650 zone in the near future could amplify the risk.
Historical Cycles Suggest Potential Bottom in Late 2026
In a recent analysis, Martinez referenced historical Bitcoin cycles. In both 2017 and 2021, Bitcoin reached its peak before entering bear markets that lasted approximately 364 days each. The first bear market saw an 84% decline, while the second experienced a 77% drop. If the current cycle's top occurred in October 2025, a similar pattern would imply a market bottom around October 2026.
Martinez suggested that this timing could present an "ideal buying opportunity" based on the historical patterns of bear market lows. This outlook aligns with the structure observed in earlier cycles, where a prolonged drawdown was followed by a period of accumulation before the commencement of the next upward price movement.
Divergent Opinions on Bitcoin's Future Trajectory
Some analysts hold the view that Bitcoin is currently in a broader bearish trend. As previously reported, data indicates an increase in Bitcoin being moved to exchanges, which could signal intentions to sell. Other market observers have noted a more permanent shift in market structure, potentially leading to extended periods of price weakness.
However, analyst Egrag Crypto offers a different perspective. He stated, "Fitting charts into a narrative is one of the biggest traps in TA." Egrag Crypto believes that current market conditions differ significantly from those in 2021 and that moving averages may no longer provide reliable signals. Instead, he emphasizes the importance of the 21-week Exponential Moving Average (EMA) and asserts that the market is still maintaining its structure.
He argues that the bullish trend remains intact and views the current price action as a retest of long-term support levels. Furthermore, Egrag maintains a bullish outlook, anticipating that the market is heading towards the 1.618 Fibonacci extension, projected to be around $175,000.