

DOGE enters a decisive technical zone as price action compresses near a falling wedge boundary, while derivatives indicators reflect cooling activity but continued bullish positioning, creating a cautious backdrop for traders awaiting a momentum-driven breakout.
- •DOGE tests a major falling wedge boundary as downside momentum slows across recent sessions.
- •Derivatives activity cools while leading exchanges show a firm long-side bias in positioning.
- •Liquidation flows reveal early upside pressure followed by measured corrective phases.
Falling Wedge Structure Approaches Break Point
DOGE price begins with the falling wedge formation observed by Clifton Fx, who notes the asset’s attempt to test the upper trendline. Price as of writing traded between $0.1478-$0.1529, settling near $0.150–$0.151 late in the session. The wedge shows a long series of lower highs and lower lows forming a narrowing structure.
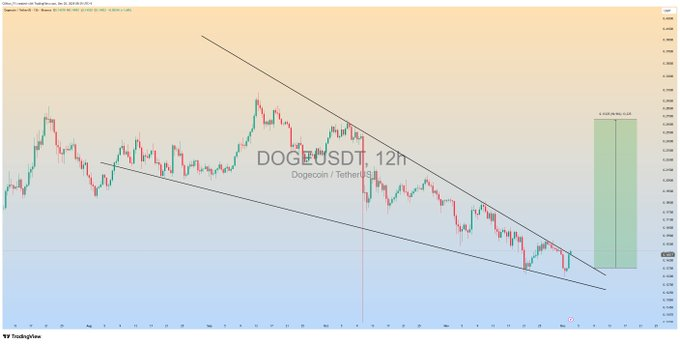
Recent candles show weaker downside movement. Earlier waves inside the wedge were broader, while later declines formed smaller bodies and shorter retreats. This behavior points toward diminishing seller strength as DOGE repeatedly holds the lower trendline without clean breakdowns.
The breakout requires a strong close above resistance. Clifton Fx stresses that a momentum candle is essential for confirmation. Without that close, the pattern remains inactive. If confirmed, the projected target sits around the 0.10–0.11 zone, which aligns with the chart’s measured extension.
Derivatives Metrics Reflect Cooling Participation
DOGE derivatives activity presents a mixed structure across exchanges. Total derivatives volume declined 9.86% to $3.35 billion. Open interest slipped 1.38% to $1.48 billion. These moves suggest temporary lower engagement rather than a shift in broader conviction.

Options behavior shows a sharper adjustment. Options volume dropped 79.65% to $13.47K, yet options open interest rose 0.46%. This combination shows that existing positions stayed active as traders avoided adding short-term volatility exposure.
Long/short ratios remain constructive. The global ratio stands at 1.0263. Exchange-specific data shows stronger long positioning, with Binance accounts at 2.5436 and OKX accounts at 2.69. This pattern suggests consistent bullish preference even during reduced trading activity.
Liquidation Flows Capture Earlier Upside Movements
Liquidation data adds more structure to the DOGE narrative. In the 1-hour window, total liquidations reached $29.80K, with shorts slightly larger. The 4-hour figure shows $64.39K, mostly from long positions during a minor retracement phase.
The 12-hour period shows $1.01M in liquidations, with short positions dominating at $887.28K. This suggests an earlier upward move that forced shorts to close. The 24-hour figure totals $5.07M, split between $3.49M from shorts and $1.58M from longs, reflecting early upward pressure followed by controlled pullbacks.
Leading exchanges such as Binance, OKX, Bybit, and Bitfinex remain the center of DOGE derivatives activity. Their long ratios align with the falling wedge breakout scenario. Traders now await a decisive momentum candle that confirms a transition from compression into expansion.