

Key Insights
- •DOGE has entered a critical demand zone, mirroring historical patterns that preceded bullish breakouts.
- •The Wyckoff Accumulation pattern suggests DOGE may be advancing towards Phase D, potentially targeting range resistance.
- •A MACD bullish crossover and the test of a descending trendline are key factors that could influence DOGE's future price movements.

DOGE Reclaims Support Between $0.13 and $0.14
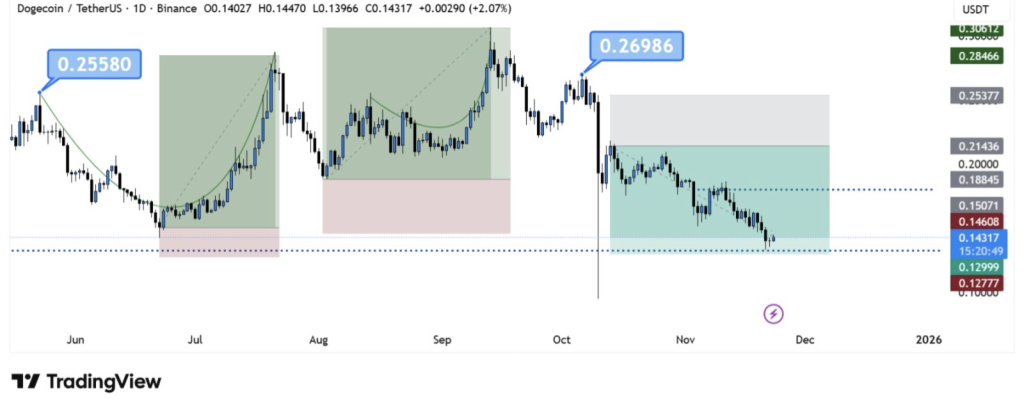
Dogecoin (DOGE) has returned to a familiar support range, with market participants observing for indications of another potential rally. This price zone has garnered significant attention following past patterns where similar dips were succeeded by price movements toward the $0.25 level.
The current price level for DOGE has fallen back into a demand zone that has successfully provided support on multiple occasions throughout the year. This area, situated between $0.13 and $0.14, has historically served as a launching point for upward price movements. Current market observers are closely monitoring this range for signs of a potential bounce.
According to analysis shared by BitGuru, DOGE has exhibited a repeating pattern of dipping into support levels, followed by rallies to the $0.25–$0.27 zone before experiencing reversals. This recurring behavior has heightened expectations that a similar price action might unfold once again.
At present, DOGE is trading at $0.146211, with a daily trading volume of $1.49 billion. The price has seen an increase of 2.17% over the past 24 hours. Traders are now focused on whether DOGE will break through or be rejected at the current trendline, as this outcome is expected to significantly influence its next price trajectory.
Wyckoff Accumulation Pattern Observed
Furthermore, based on analysis from Trader Tardigrade, Dogecoin has been developing a Wyckoff Accumulation pattern since reaching its 2024 high. This analyst suggested that the asset may have already completed the "Spring" phase, which represents the lowest point of the market cycle. He further indicated that the Phase D point is anticipated to drive DOGE back towards the resistance level at the top of the horizontal range.
If the observed pattern adheres to its traditional structure, the subsequent phase could potentially lead to a breakout above the Phase E range. The Wyckoff method is a widely utilized analytical tool for studying market cycles and identifying periods of accumulation prior to the commencement of new trends.
While this crossover is interpreted by some as a potential indicator of strengthening momentum, resistance from the descending trendline might constrain short-term price movements. Trader Tardigrade noted that DOGE is approaching this Descending Trendline, adding that this specific level could be pivotal in determining the coin’s direction in the immediate future.
This technical setup has emerged in the wake of a MACD bullish crossover, a signal that traders commonly employ to detect early shifts in momentum. The confluence of these technical indicators alongside historical price behavior is maintaining a high level of interest in the current DOGE market setup.