

Dogecoin (DOGE) is showing renewed bullish strength this weekend as multiple technical and on-chain indicators align in its favor. Analysts say the memecoin’s latest breakout against Bitcoin, combined with a clear bull flag formation on the USD pair and major whale accumulation near $0.20, could set the stage for its next major rally.
Key Takeaways
- •DOGE/BTC breakout: Dogecoin is outperforming Bitcoin after consolidating in a tight range.
- •Bull flag pattern: Trader Tardigrade identifies a bullish continuation setup targeting a move above $0.20.
- •Whale activity: Glassnode data shows 11.12 billion DOGE accumulated around $0.20, marking it as a key resistance zone.
DOGE/BTC Chart: Breakout From Consolidation
According to Trader Tardigrade, the DOGE/BTC pair has broken out of a sideways consolidation range on the hourly chart. The chart shows that Dogecoin traded within a narrow zone between 0.0000150 and 0.0000164 BTC for several days before breaking higher on November 8. The breakout candle pushed the pair toward 0.0000182 BTC, confirming the shift in short-term momentum.
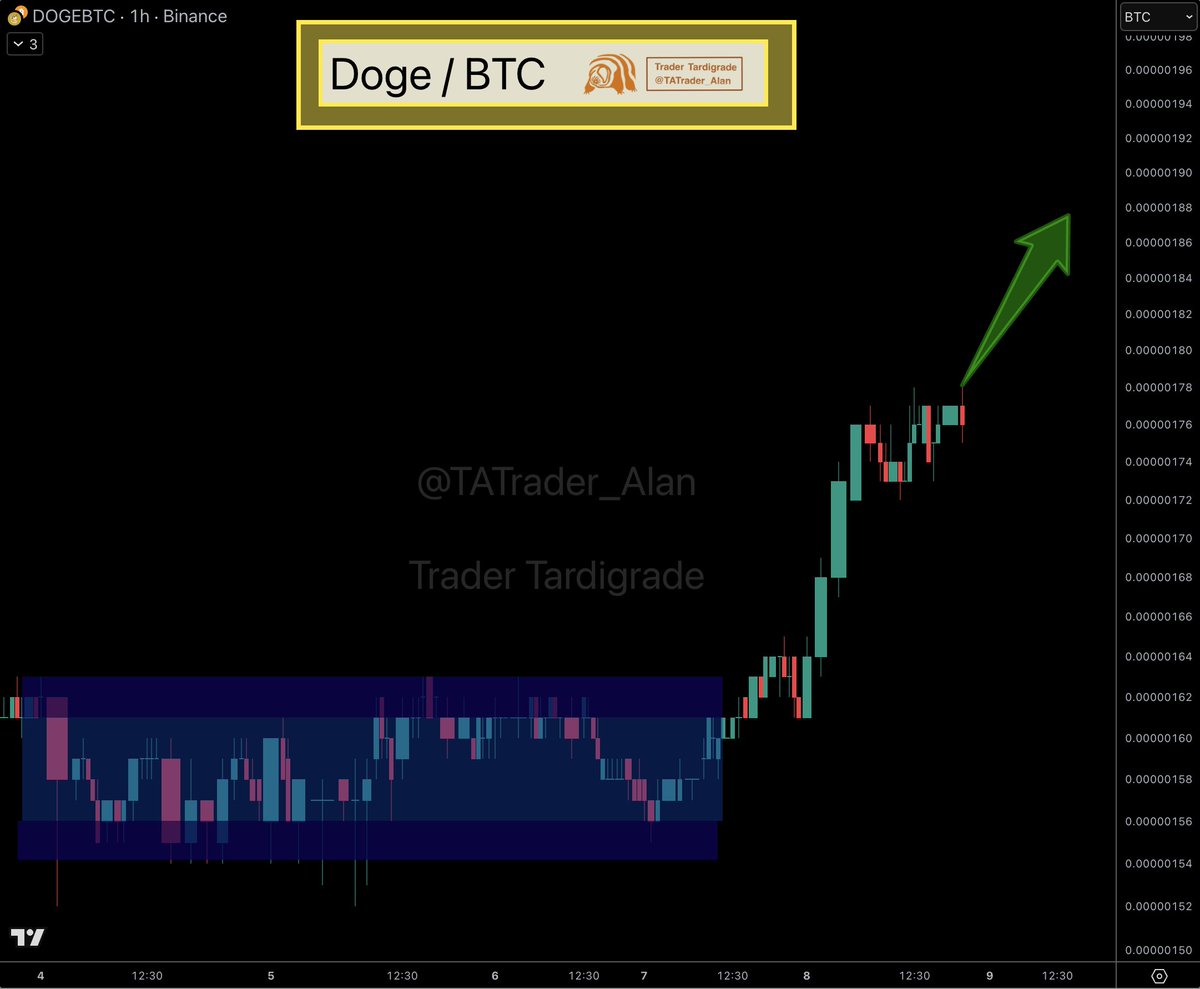
Tardigrade’s chart highlights this move with a green arrow projecting continued strength, implying that Dogecoin is gaining market share against Bitcoin, often an early sign of renewed retail momentum in the memecoin sector.
DOGE/USD: Bull Flag Points to Potential Move Above $0.20
In a separate 2-hour chart, Tardigrade identified a bull flag pattern forming on the DOGE/USD pair. A bull flag typically signals consolidation after a strong upward move, followed by another leg higher once resistance is broken.
$Doge/2-hour #Dogecoin is forming a Bull Flag, which could send $Doge back above 20 cents 🔥 pic.twitter.com/g6EvDrdo2t
— Trader Tardigrade (@TATrader_Alan) November 8, 2025
The setup began forming after Dogecoin surged sharply from $0.17 to $0.18, then moved into a compressed triangle range. The flag’s upper boundary currently sits around $0.182, and a breakout above it could trigger a continuation rally toward $0.205–$0.21, based on the flagpole height projection.
This structure indicates that Dogecoin’s rally may only be pausing, not reversing, and that a breakout could coincide with renewed speculative inflows.
Whale Accumulation Near $0.20 Could Be the Key
On-chain analyst Ali (@ali_charts) shared a Glassnode cost basis distribution heatmap showing that 11.12 billion DOGE were accumulated between $0.20 and $0.203.
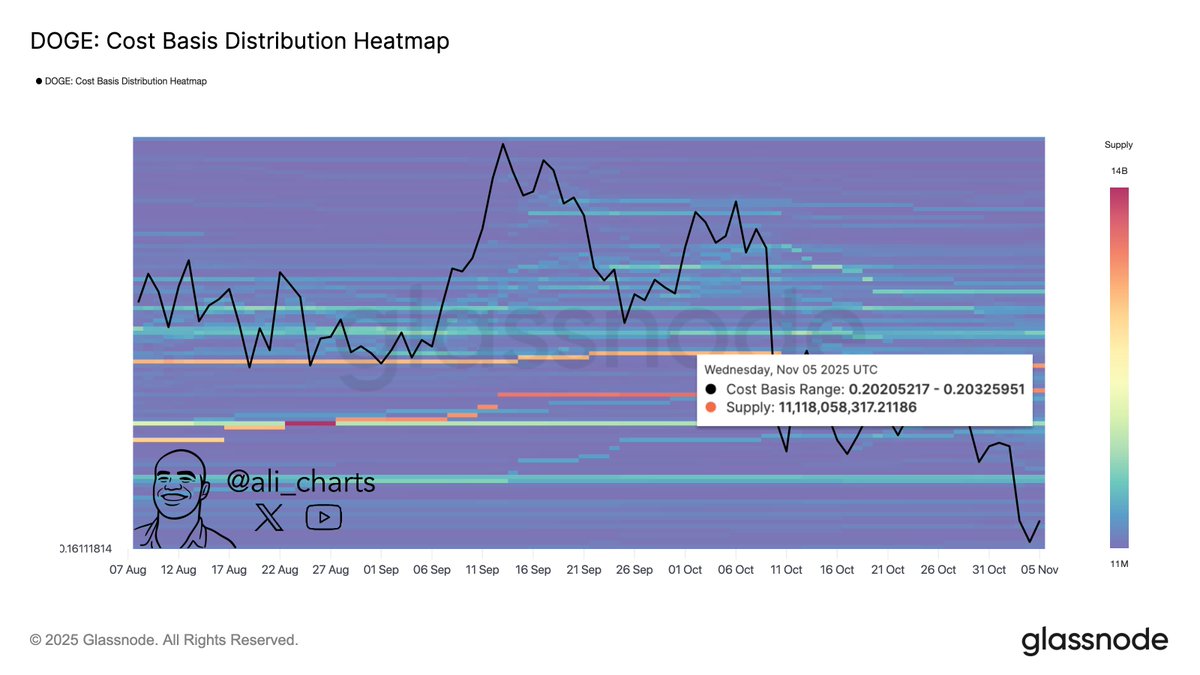
This zone now represents a major area of resistance where many wallets are likely to take profits once prices revisit that range. However, a decisive close above it could signal a strong continuation of the uptrend, potentially pushing Dogecoin toward its next macro target around $0.25.
The heatmap visualization reveals dense horizontal bands around $0.20, marking a cluster of large holders’ entry points. Historically, when Dogecoin breaks through such clusters with strong volume, it triggers sharp rallies as sell walls are absorbed by demand.
Outlook: A Bullish Structure Building Beneath the Surface
Dogecoin’s alignment across technical, on-chain, and sentiment indicators paints a bullish picture in the short term.
With DOGE now trading around $0.18, a sustained breakout above $0.182–$0.185 would validate the bull flag and test the critical $0.20 resistance zone. If volume and momentum continue to build, analysts suggest the next target could extend to $0.25–$0.27, where previous mid-cycle highs occurred earlier this year.
In contrast, failure to hold above $0.17 could delay the breakout and lead to a retest of support around $0.162–$0.165.
For now, the charts show one clear message: Dogecoin’s bullish structure remains intact, and both traders and whales appear to be positioning for the next upward move.