

Key Insights
- •Ethereum is encountering resistance at its 200-day Exponential Moving Average (EMA), hindering a breakout rally.
- •Short-term consolidation patterns suggest a wave 4 correction, with potential for upside if support levels are maintained.
- •A significant increase in trading volume and a daily close above $3,338 could propel Ethereum towards the $4,000 mark.
Ethereum is currently trading just below its 200-day Exponential Moving Average (EMA), which is situated at $3,338.76. The cryptocurrency's price, last observed at $3,281.93, continues to face challenges at this significant technical level. In recent trading sessions, buyers have managed to push Ethereum close to the 200-day EMA, but sellers have consistently emerged to prevent further upward movement.
This price zone is closely monitored by market participants as a key indicator of market sentiment and trend direction. Ethereum has not yet achieved a daily candle close above this level during its current attempt, contributing to market caution. Many traders are observing this area intently, anticipating a decisive break and a strong daily close above it.
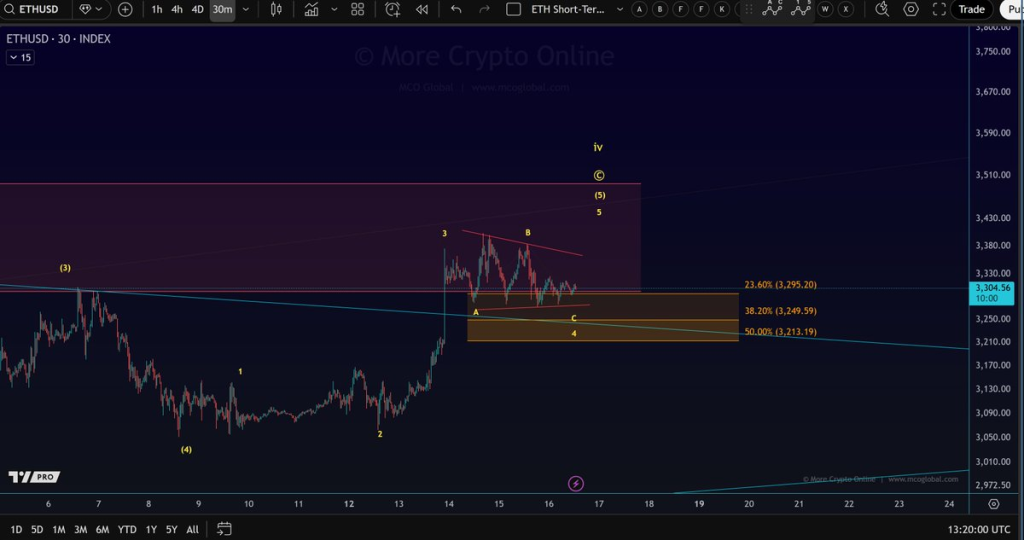
Short-Term Chart Shows Ongoing Correction
An analysis of Ethereum's 30-minute chart indicates a period of sideways movement that aligns with a wave 4 corrective pattern, as described by Elliott Wave theory. Following a sharp price increase earlier in the week, the market is now consolidating within a narrow range. This consolidation appears to be forming an A-B-C structure, which is a common characteristic of correction phases.
Crucial support levels are holding firm between $3,249 and $3,213. Ethereum has managed to stay above the 23.6% Fibonacci retracement level at $3,295, suggesting potential underlying strength. Some analysts anticipate a further upward push if the lower support band continues to remain intact. An update from More Crypto Online noted:
“One more high is still likely for now.”
Volume and Trend Indicators Remain Mixed
Ethereum has recorded $24.1 billion in trading volume over the last 24 hours. Despite a slight dip of 1.1% in price during this period, Ethereum has seen a 5.6% increase over the past week. This combination of short-term weakness and weekly strength contributes to the prevailing uncertainty surrounding the current price level.
Should Ethereum reclaim the 200-day EMA with substantial volume support, the next significant price target could be in the range of $3,800 to $4,000. Previous price action patterns suggest this range as the next area of potential interest. Until this breakout occurs, Ethereum may continue to trade sideways or test support levels near $3,100 if selling pressure intensifies.
Key Levels to Watch
Short-term support for Ethereum is identified in the $3,213 to $3,249 range, with immediate resistance at $3,338. Traders are closely monitoring for a clear break from the current consolidation phase. A confirmed upward movement above the 200-day EMA could signal a shift in momentum towards the upside.
As observed by market analysts, "the support zone must hold to keep the bullish structure intact." Maintaining price stability above this critical area could pave the way for a potential wave 5 advance in the upcoming trading sessions.