
General Evaluation
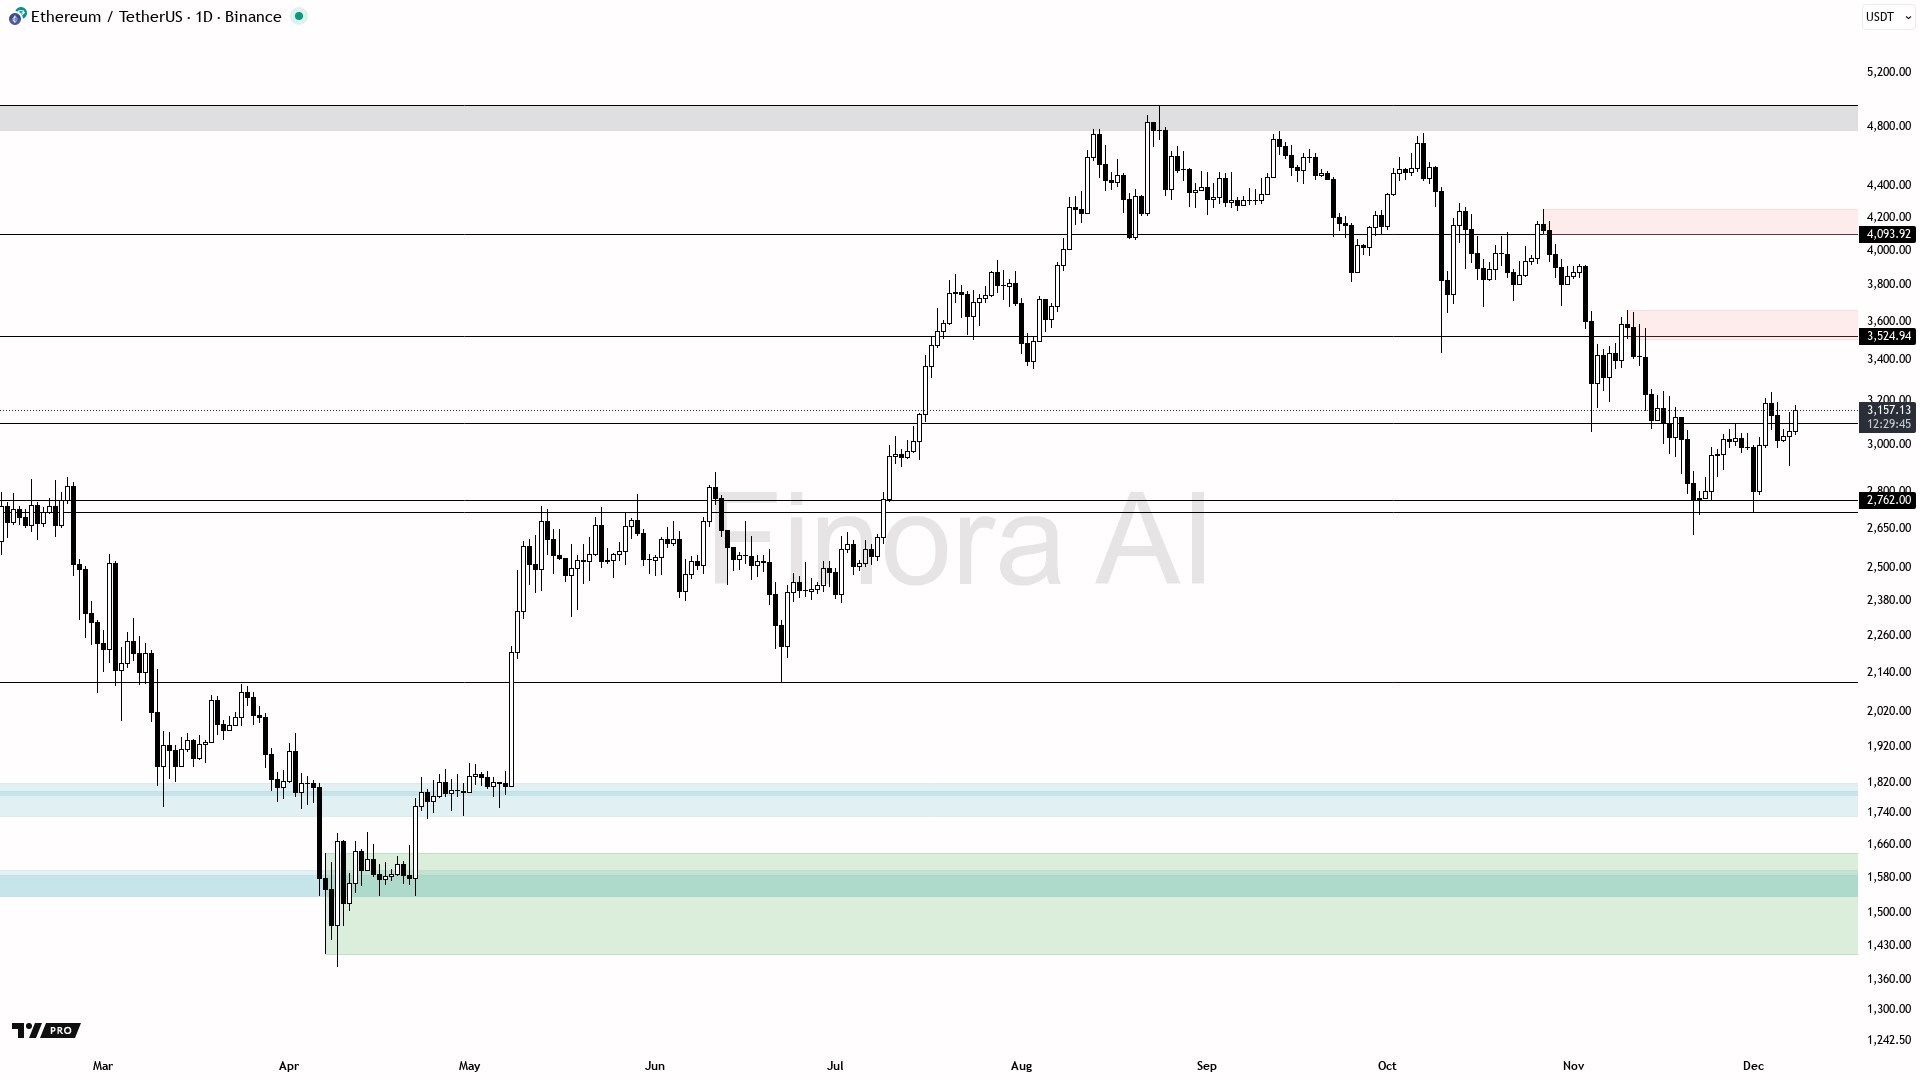
ETHUSDT is currently trading at 3158.72, sitting just above the equilibrium level of the most recent swing price action, which is at 3141.27. The broader trend is still leaning bearish, but there are several bullish signals and mixed indicator directions suggesting momentum could shift. The most recent high of the last swing was 3658.98, and the most recent low was 2623.57. Volume and volatility are decent, with ATR at 183.94, indicating a healthy range for price movement. Major indicators like MACD, Stochastic, Vortex, RSI, PSAR, and Fisher are bullish, while Momentum, DMI, and MFI are bearish. ADX is bullish, implying trend strength. Price action has been neutral lately but saw a strong bullish move 6 days ago and some bearishness 4 days ago.
Critical Levels
- •Strong resistance at 3240.35 (right above current price)
- •Additional resistance seen at 3666.90, 4142.33, 4253.72, 4386.15, and 4755.00 (watch for liquidity sweeps or manipulation at these higher levels if price rallies)
- •Local support at 3057 and 3013.73 (just below current price)
- •Further support at 2716.04, 2623.57 (the most recent low of the last swing), 2534.43, 2422.22, and a major low at 2111.89
- •Noticeable bearish FVG zones above, especially between 3191.47 and 3666.90, which could act as magnets for price if momentum continues upward
Trade Ideas
- •If ETH dips towards 3057–3013 and shows a bullish reversal (e.g., bullish engulfing, pin bar, or strong rejection wick) on the daily or even lower timeframes, a potential long setup could materialize, targeting the resistance at 3240.35 initially.
- •If price sweeps below the most recent low at 2623.57 and immediately reclaims that level with strong reversal signals (e.g., sharp rejection with volume, or reversal candle formations), this could offer a high-probability long entry, targeting 3057 and then 3240.35.
- •For shorts, a liquidity sweep and manipulation above 3240.35 or even up to the FVG zone at 3666.90 followed by bearish signals (like a bearish engulfing or strong rejection wicks) could be used to enter, targeting 3057 and 3013.73 as profit zones.
- •Always wait for confirmations like clear reversal candlesticks, increased volume, or breakdowns/reclaims on lower timeframes before entering.
Analyst Expectation
ETHUSDT is currently in a zone where a short-term bounce to 3240.35 is likely if the price holds above 3013.73 and 3057, especially if a bullish reversal is confirmed in this region. If the bounce fails and daily closes fall below 3013.73, expect acceleration down to 2716.04 and 2623.57. If bulls manage to break and hold above 3240.35 with momentum, the move could extend toward 3666.90. Watch for signs of exhaustion or rejection in that area, as it's both a resistance and a bearish FVG region.
Trade scenario example: If price dips to 3057–3013 and forms a pin bar or bullish engulfing on the daily, you could consider entering a long position, targeting 3240.35 for your first take profit. Place your stop-loss below the local swing low or the most recent low (depending on your risk appetite). If price sweeps below 2623.57 and quickly reclaims it with a strong reversal candle, this could be a high-probability long setup for aggressive traders.
If price rallies above 3240.35 and gets sharply rejected with a bearish engulfing or significant wick, you could enter a short trade, targeting first 3057, then 3013.73, with your stop-loss above the high of the rejection candle or swing high. If price breaks and closes firmly above 3240.35 with bullish confirmation, bias shifts bullish, and you could look to target 3666.90 and up.
This is an educational analysis to help you understand the current price action and key levels on ETHUSDT. Trade safe and always wait for confirmations!