

Ethereum is showing signs that have historically appeared at the start of its biggest rallies, according to multiple analysts tracking long-term cycle structures and key technical levels. While ETH remains under pressure after this week’s volatility, several high-profile traders say the current pullback is happening exactly where previous bull cycles began.
Cycle Charts Point to a Classic Accumulation Zone
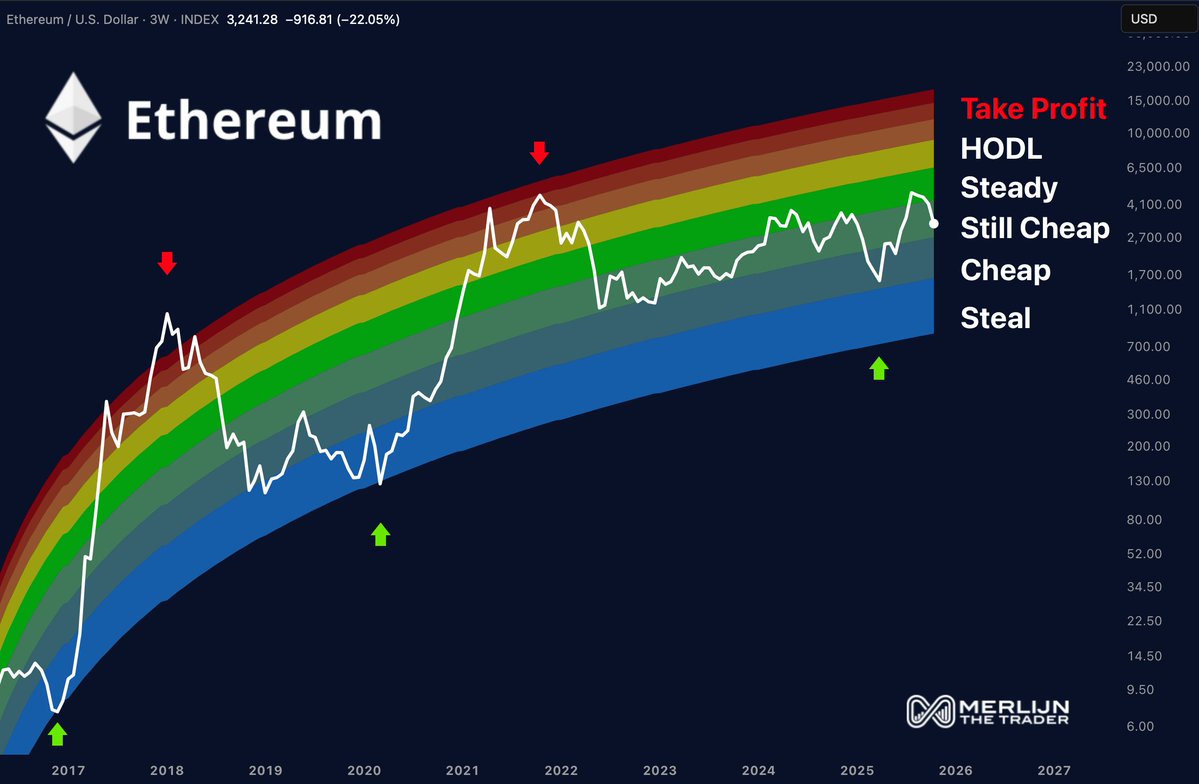
Merlijn The Trader argues that the “Ethereum accumulation window” is still open, and that most investors are ignoring it. His long-term rainbow-style model shows ETH touching the same lower-band region that marked the bottom of every major expansion since 2017.
He notes that retail typically buys once Ethereum turns red-hot near cycle tops, but long-term opportunity historically appeared in the calmer, lower-band zones, exactly where ETH is trading today.
Another chart shared by Merlijn shows ETH repeatedly retesting the same multi-year trend curve before each breakout. Each retest, labeled “Bottom” or “Retest” on the chart, eventually led to a multi-month rally. ETH is now completing yet another retest, mirroring the quiet setups seen before previous expansions.
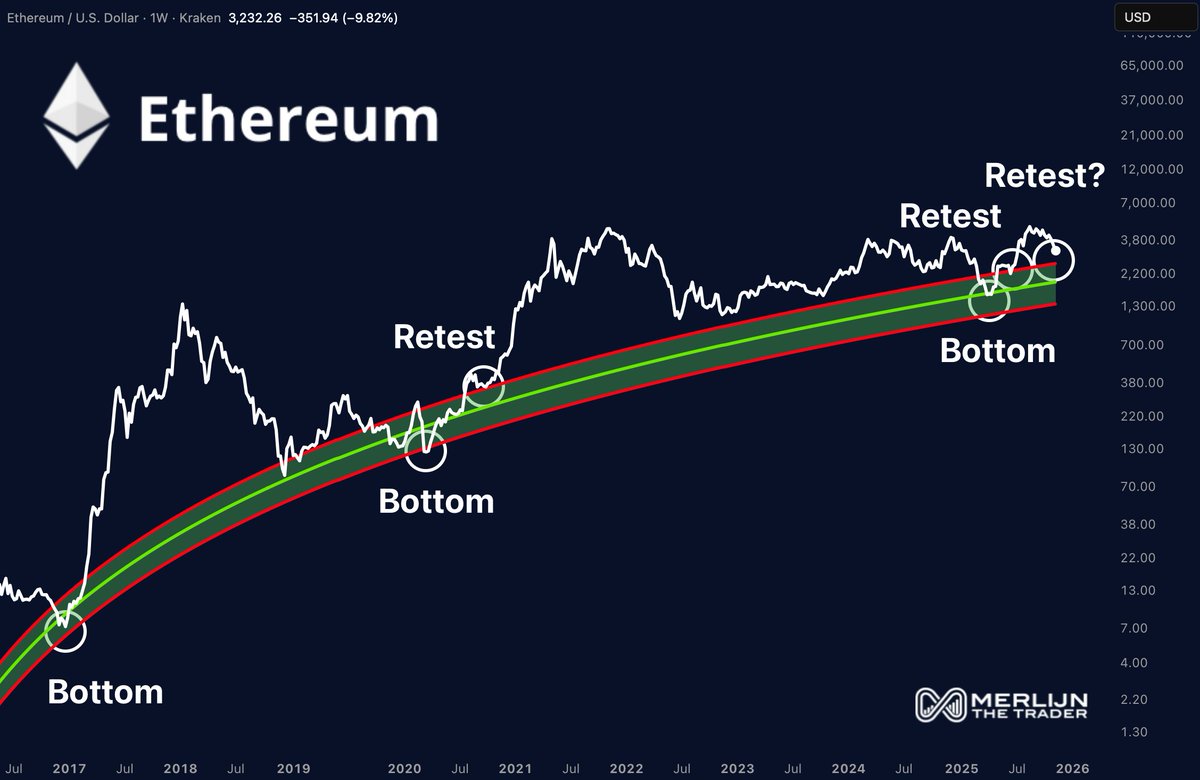
His message: the structure is unchanged, only the price is different.
Daan Crypto: ETH Defending the .618 Fibonacci Level
Analyst Daan Crypto Trades points to the .618 Fibonacci retracement area as the key battleground. ETH has successfully held this region after sweeping its November lows, a positive sign if the level continues to hold.
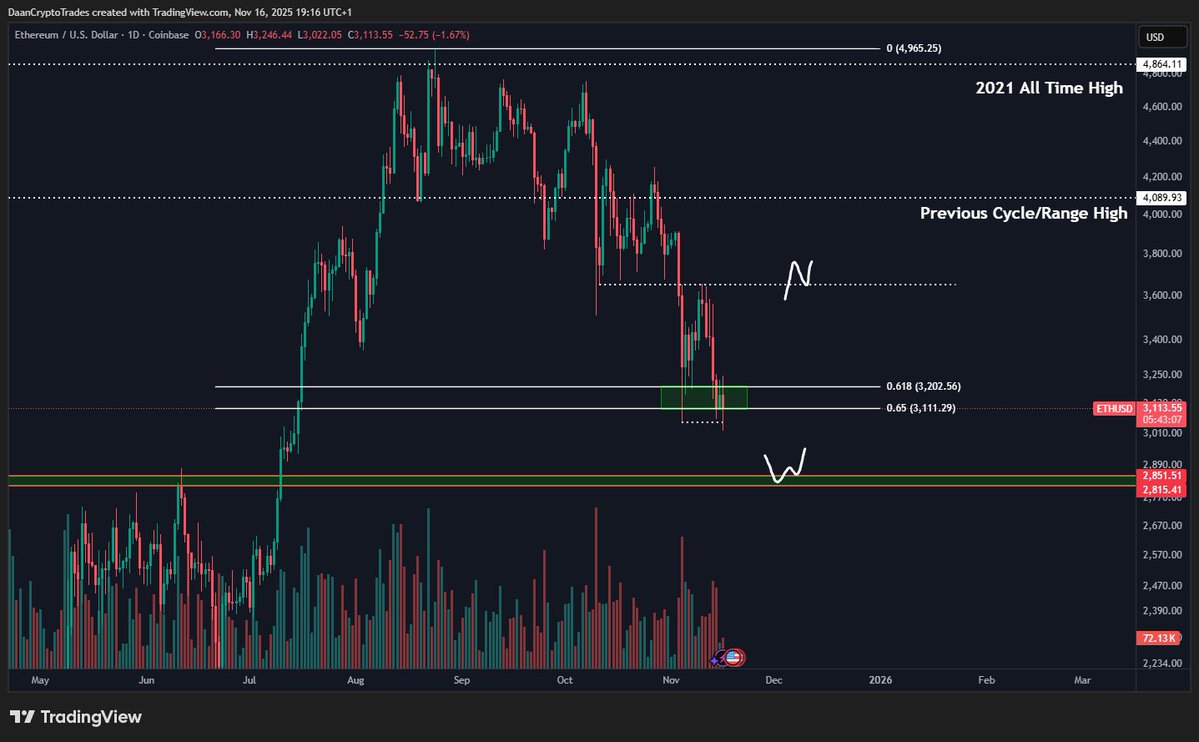
However, he also warns that the asset is “in the middle of nowhere” technically. A move above ~$3,650 would shift momentum back to the upside, while losing current support opens the door to $2,800, a major cycle support/resistance level.
His chart highlights the large gap between short-term uncertainty and long-term structure: near-term price action is fragile, but long-term trend levels remain intact.
Why Analysts See Opportunity Despite Volatility
Across all three analyses, one theme repeats: Ethereum’s long-term cycle structure hasn’t broken.
- •ETH is sitting in historical accumulation zones.
- •Multi-year curve retests are aligning with past cycle bottoms.
- •Fibonacci supports remain intact, for now.
While traders remain cautious, long-term strategists see the same setup that preceded previous expansions.
Whether ETH follows its historic pattern again or breaks from tradition will depend on how price reacts at these crucial levels.
For now, the charts suggest this moment might be more significant than it feels, and that the quiet phase of the cycle may not last much longer.