

Ethereum (ETH) is once again trading around a trendline that has provided support for its price action for nearly a decade. This particular level has historically served as a critical turning point in past market cycles.
As of the latest data, ETH is priced at approximately $3,000, with a 24-hour trading volume of $14.6 billion. The asset has seen a 7% increase over the last seven days, despite a minor dip in the past 24 hours.
Ethereum Retests Multi-Year Support Zone
A chart shared by Merlijn The Trader illustrates ETH trading within a green zone that has acted as a foundational support level since 2016. This area has previously marked significant cycle lows, which were subsequently followed by substantial upward price movements. Both the price action observed in 2017 and 2020 followed a similar trajectory: a bottoming phase, a retest of this support, and then a sharp expansion in price.

Remarkably, the current price level is nearing this historical support zone again. Ethereum is exhibiting behavior that mirrors past cycles, where the retest phase ultimately led to strong breakouts. To date, this specific trendline has not been decisively broken since its formation.
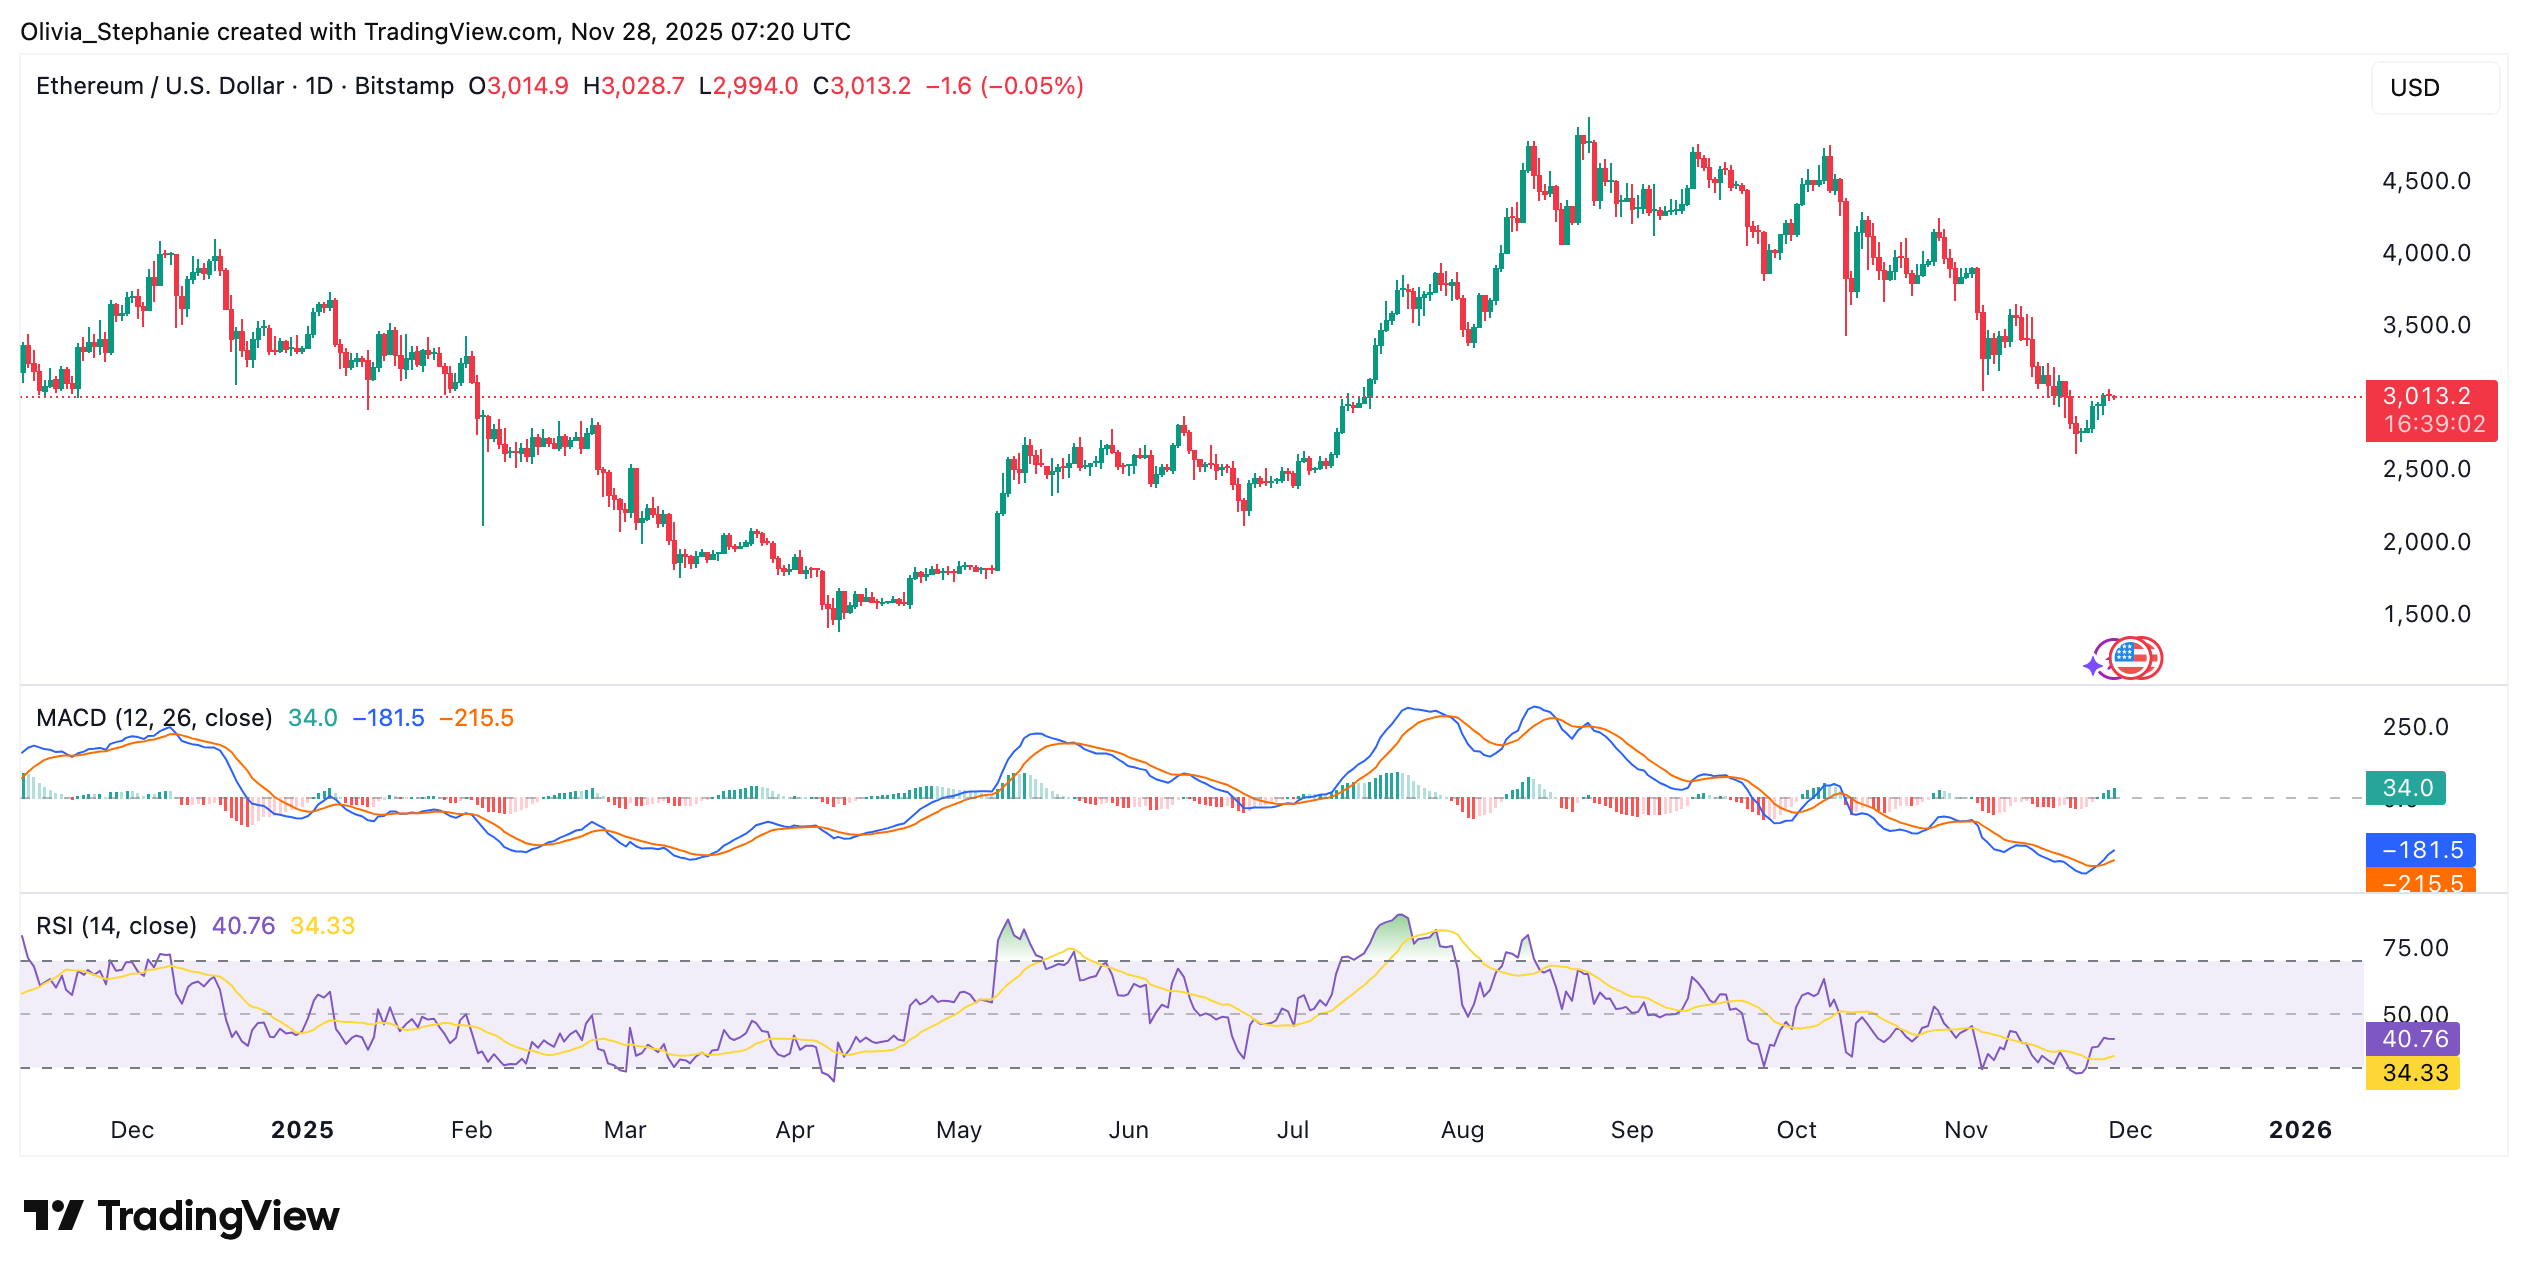
Concurrently, technical indicators are suggesting a potential shift in short-term momentum. The daily Relative Strength Index (RSI) is currently at 40.76. While still below the 50 neutral line, it shows a recovery from previous lower levels, indicating that bearish pressure may be decelerating.
Furthermore, the MACD (Moving Average Convergence Divergence) indicator has turned positive, with a recent crossover above its signal line. The current MACD value stands at 34. This development follows several weeks of negative momentum and points to the early stages of building strength.
Whales Absorb Sell Pressure in Liquidity Sweep
Merlijn also shared a liquidity heatmap that revealed significant buy interest concentrated between the $2,750 and $2,850 price levels. Ethereum experienced a dip into this zone and subsequently rebounded.
“Price nuked into a massive bid wall. Whales absorbed it in silence,” he posted.
Shortly after this event, ETH swept the sell-side liquidity zone located near $3,200 before experiencing a pullback. The current trading range, between $2,950 and $3,050, is showing indications of quiet accumulation. Merlijn commented, “Next phase: fake-out the late buyers. Don’t blink.” This particular phase often precedes a more significant directional move in the market.
Levels to Watch
Daan Crypto Trades highlighted that ETH is currently positioned between the $2,600 and $3,000 price levels. A sustained move above $3,050 could potentially target the $3,300–$3,400 range. Conversely, a break below $2,600 would signify a structural shift, bringing the $2,000–$2,200 area into focus.
In parallel, analysts are observing that ETH could potentially reach between $9,000 and $10,000 if the current market pattern unfolds as anticipated. While the foundational setup appears to be in place, they emphasize the importance of monitoring key price levels before expecting a continuation of any upward trend.