

Ethereum is entering a phase that closely mirrors its historical pre-rally structures, according to multiple analysts who note that ETH’s current consolidation resembles the 2017 and 2020 accumulation zones that preceded major expansions. Fresh chart data from TradingView and new commentary from Master of Crypto and Daan Crypto Trades suggest that ETH may be building the foundation for its next major cyclical move, even as the broader crypto market remains volatile.
Ethereum Repeats Its Historical Rhythm: Sideways, Dip, Expansion
As highlighted by Master of Crypto, Ethereum’s last three major cycles, 2017, 2020, and now 2025, share an almost identical pattern. In each case, ETH spent months moving sideways, followed by a final dip that flushed out weak hands before launching a sustained rally.
The analyst notes that ETH is again forming a compression box on the chart, nearly identical to those seen before past multi-month expansions.
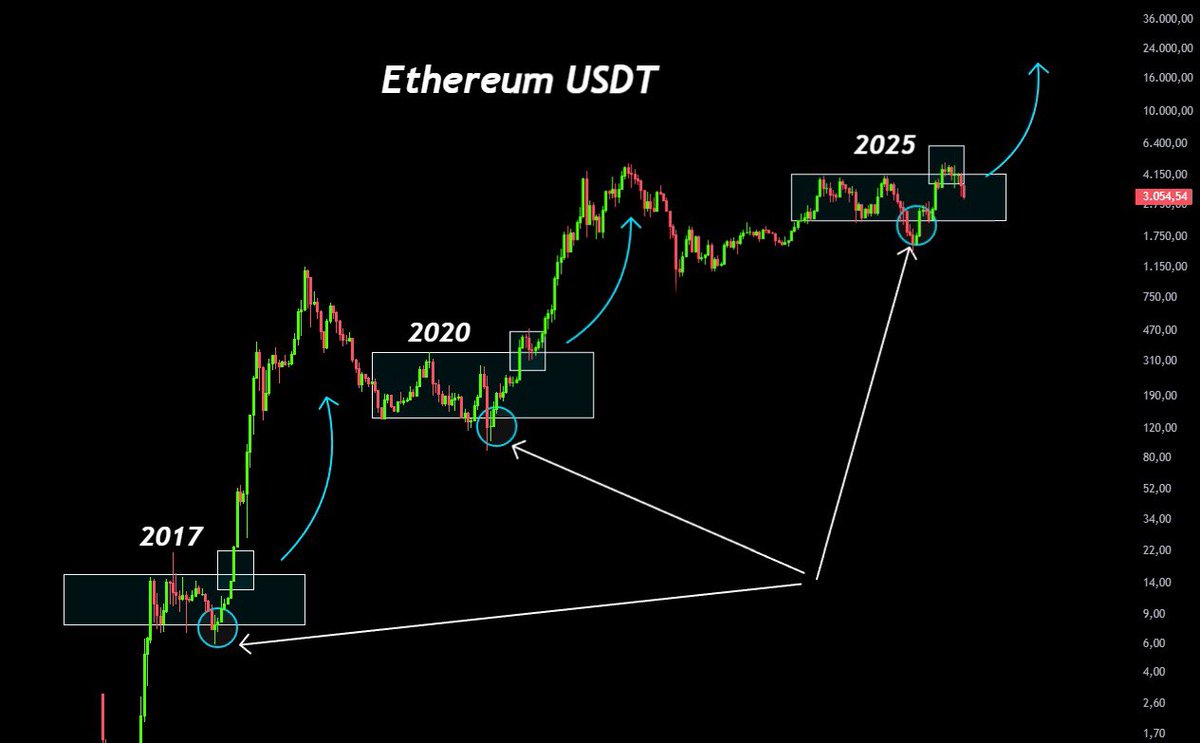
In 2017, ETH consolidated at the $7–10 region before exploding upward. In 2020, ETH repeated the same structure around $200–250. Now in 2025, that same box has formed around the $3,000 region.
This repeating pattern suggests that Ethereum may once again be approaching the end of a major re-accumulation phase.
ETH Price Action: A Volatile Week Ends with Fresh Support Test
ETH is currently trading near $3,052, after a sharp market-wide pullback triggered by Bitcoin’s break below $90,000 earlier in the week. Despite volatility, Ethereum has continued to print higher lows on the lower time frames and remains above major support.
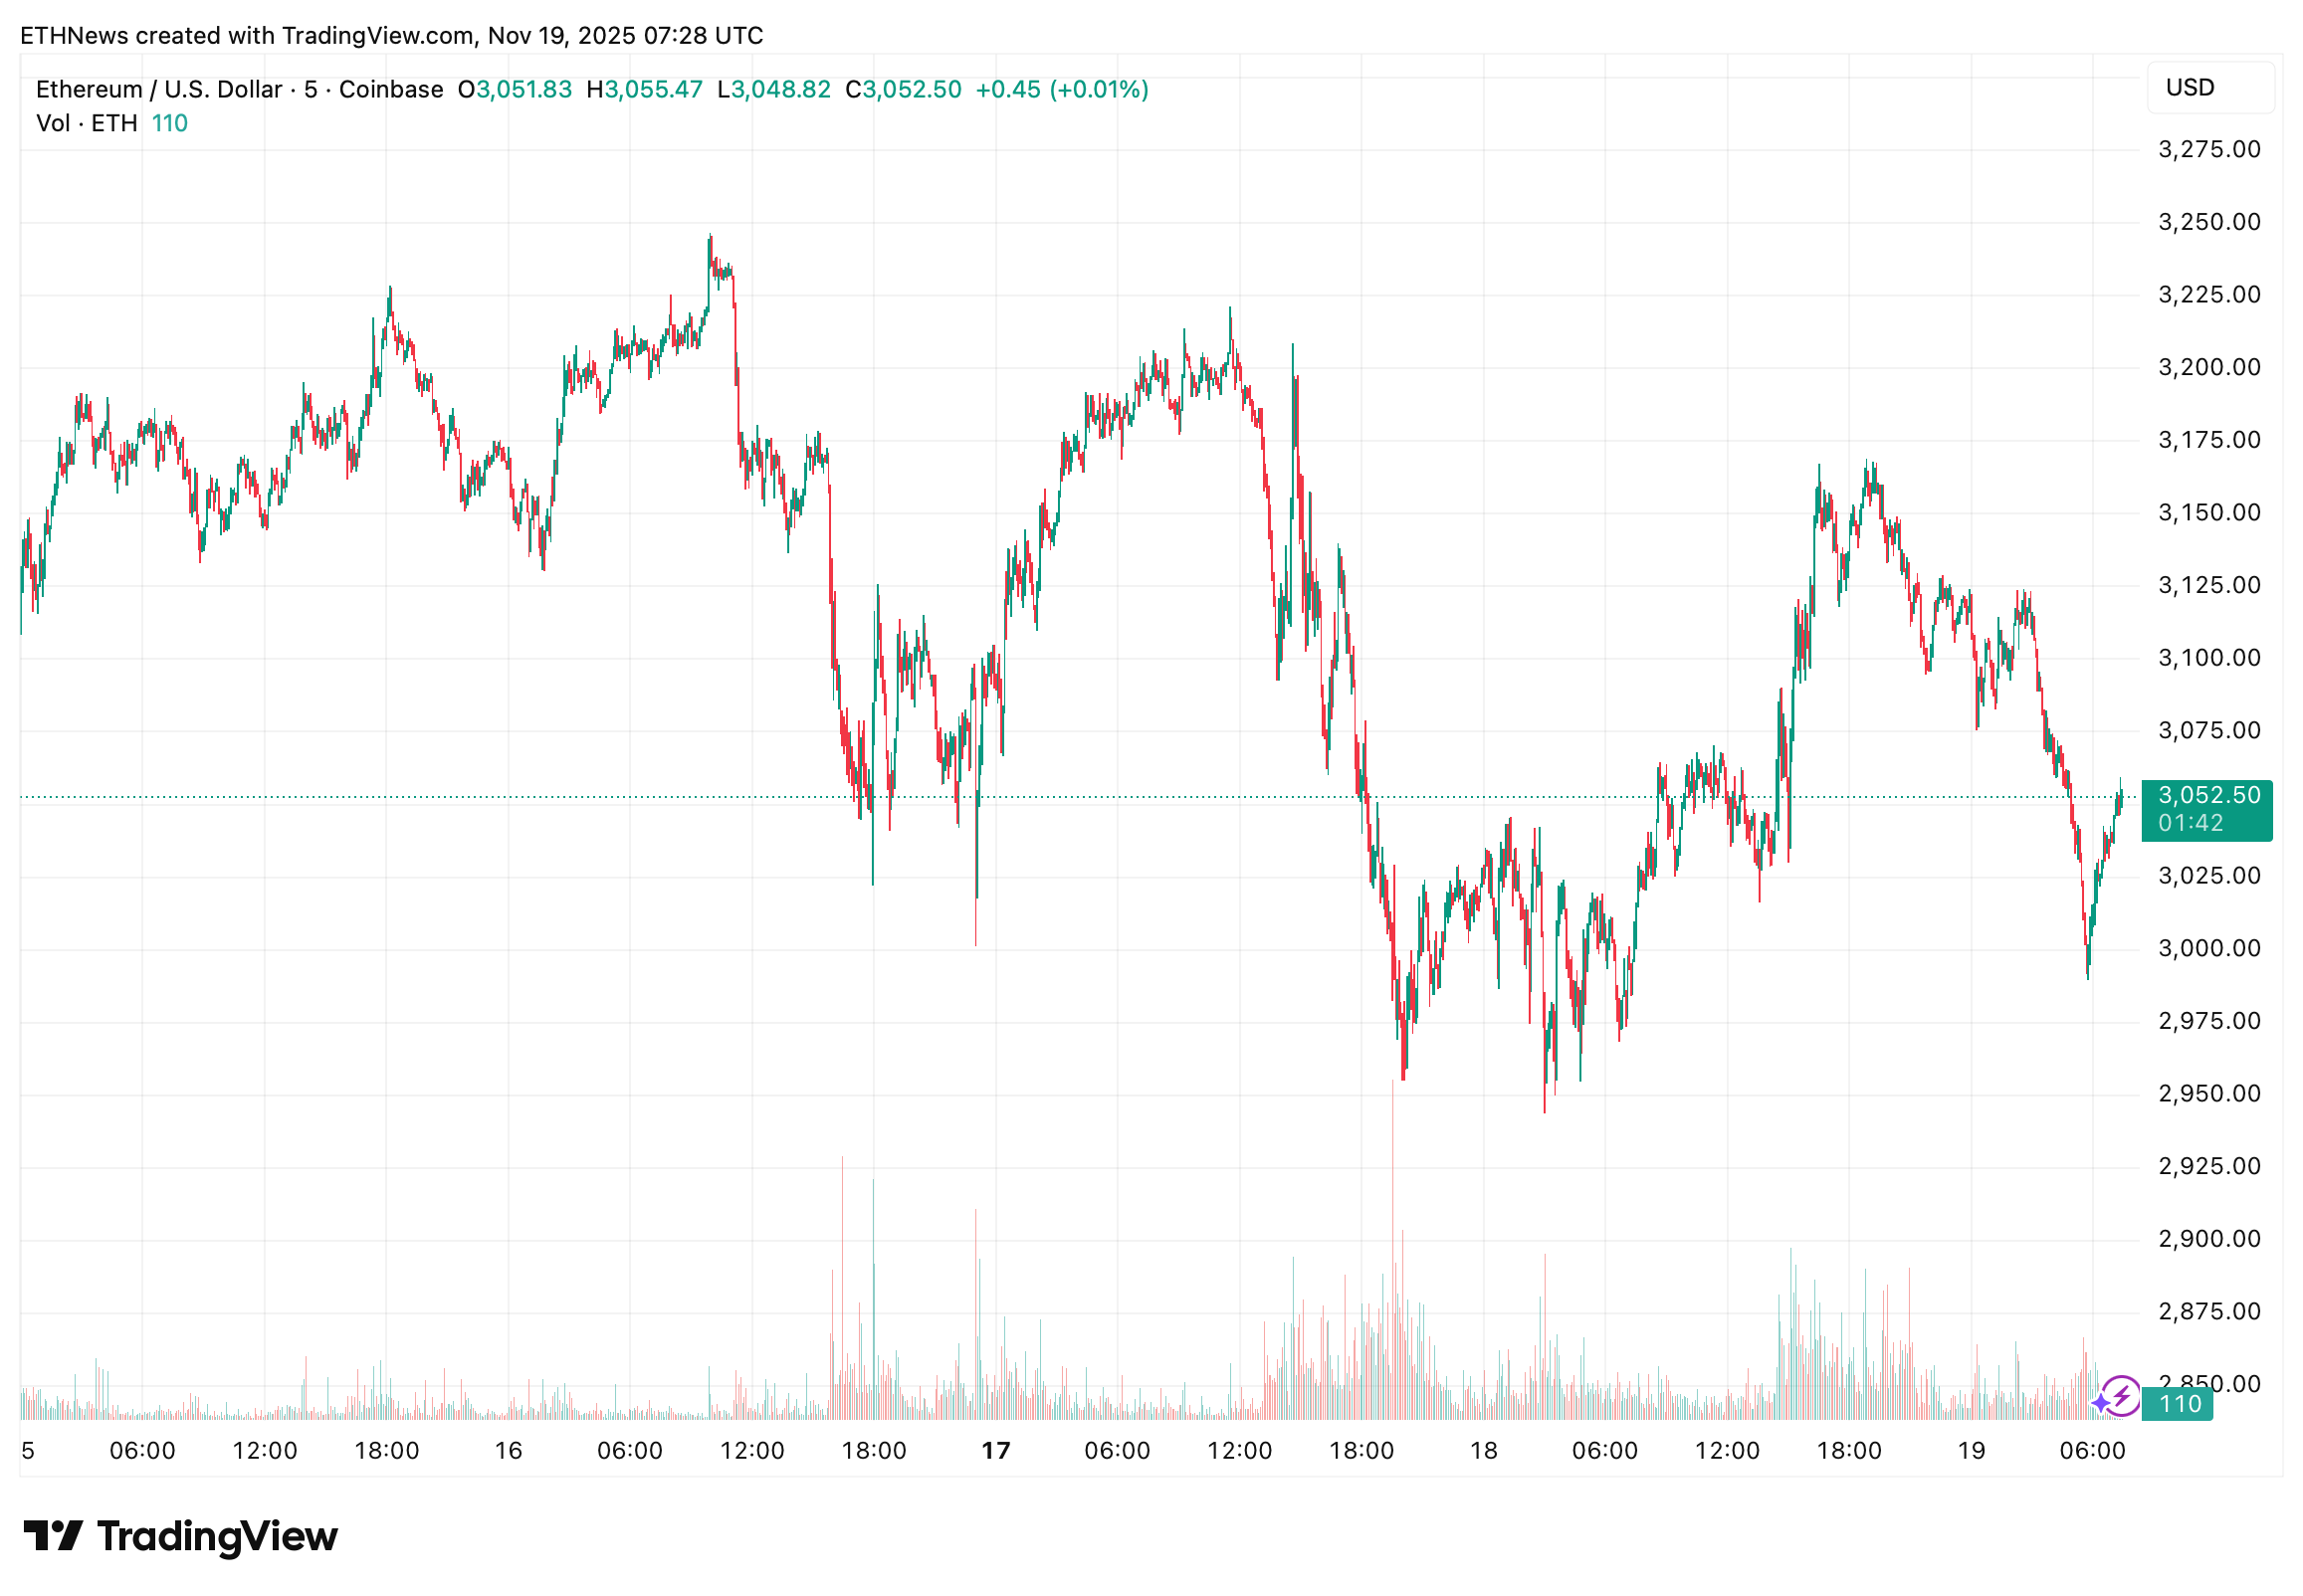
The TradingView chart shows that ETH is defending the $3,000–3,050 zone, which is consistent with the broader compression pattern described in the cycle analysis. Volume has also begun to stabilize as buyers re-enter the market following panic selling.
ETH/BTC Ratio Holding Strong, Critical Signal for Altcoin Market
Daan Crypto Trades emphasized the importance of the ETH/BTC chart, which has now tested the 0.032 level repeatedly and continues to hold it as support. This ratio is traditionally viewed as a measurement of the altcoin market’s strength relative to Bitcoin.
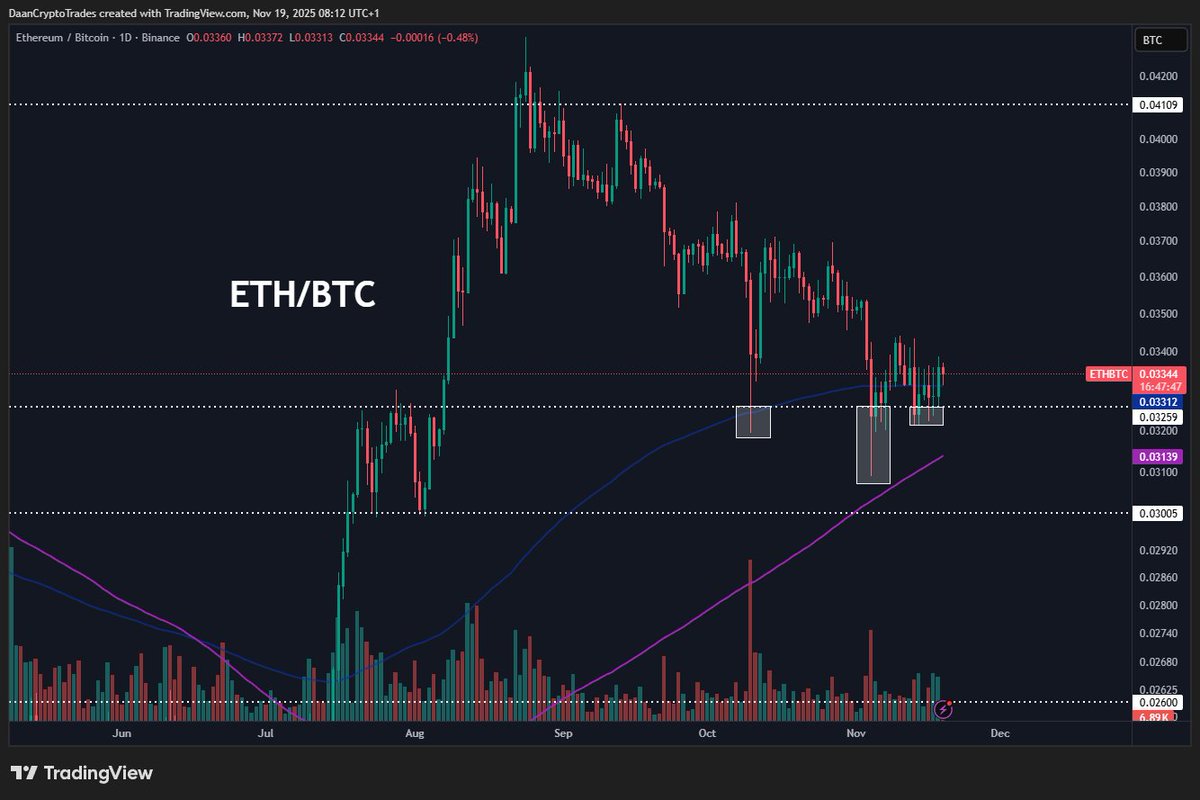
ETH/BTC holding its line is significant for three key reasons:
- •It marks a higher-timeframe support zone tested multiple times.
- •The 200-day EMA and MA have now caught up, reinforcing structure.
- •Historically, altcoin rallies start when ETH/BTC holds or reverses at major levels.
The analyst calls it a “clean invalidation level,” meaning that as long as ETH holds above 0.032, the broader altcoin market remains positioned for strength.
Why This Compression Matters for Ethereum’s Next Move
Across multiple cycles, Ethereum has shown a tendency to consolidate for extended periods before breaking into vertical expansions. The current setup contains several historically bullish factors:
- •Sideways accumulation similar to pre-2017 and pre-2020 breakouts.
- •A final downward flush consistent with cycle resets.
- •Strong defense of multi-year ETH/BTC horizontal support.
- •Price holding above long-term moving averages.
The combination of structural compression and strong ratio support suggests that ETH may be forming the base of a major cyclical move, though there is no confirmed breakout yet.
Conclusion: Ethereum Is Approaching a Familiar Turning Point
While no market cycle is guaranteed to repeat, Ethereum’s technical structure in late 2025 is strikingly similar to prior pre-expansion phases. Analysts agree that the current compression zone and ETH/BTC resilience are key indicators to monitor.
If ETH continues to defend the $3,000 level and maintains its crucial 0.032 BTC ratio support, the conditions for an upside breakout, potentially aligning with previous cycle timing, remain firmly in place.