Key Insights
- •Approximately 869,000 ETH were accumulated around the $3,700 price point, establishing a strong resistance level.
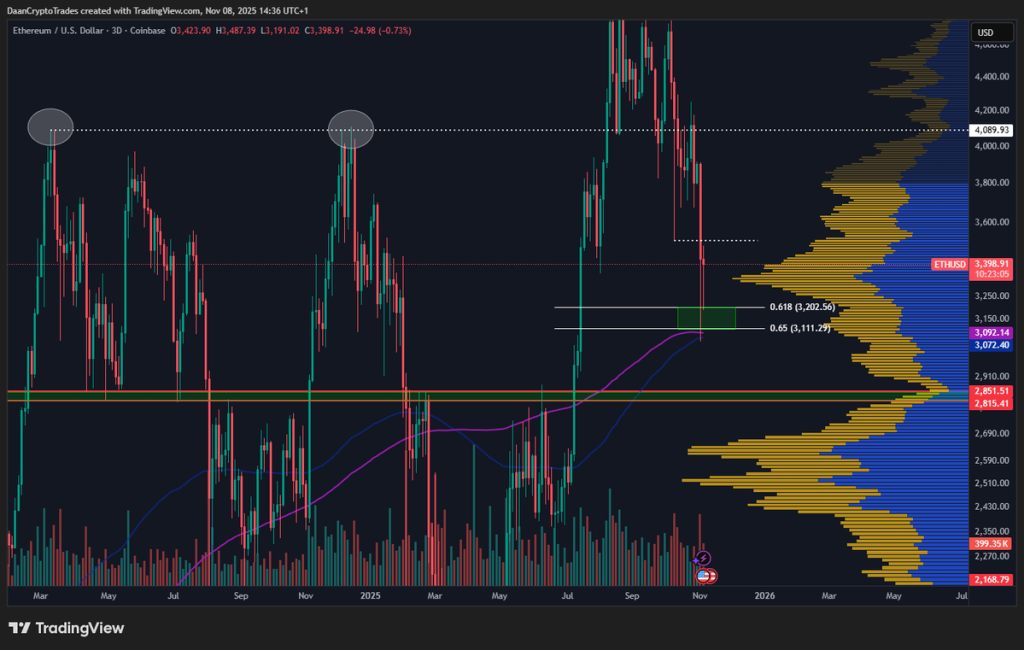
- •Ethereum has shown resilience by bouncing from its 200-day moving average (MA), 200-day exponential moving average (EMA), and the 0.618 Fibonacci retracement level, maintaining its position within the $2.8K–$4.1K range.
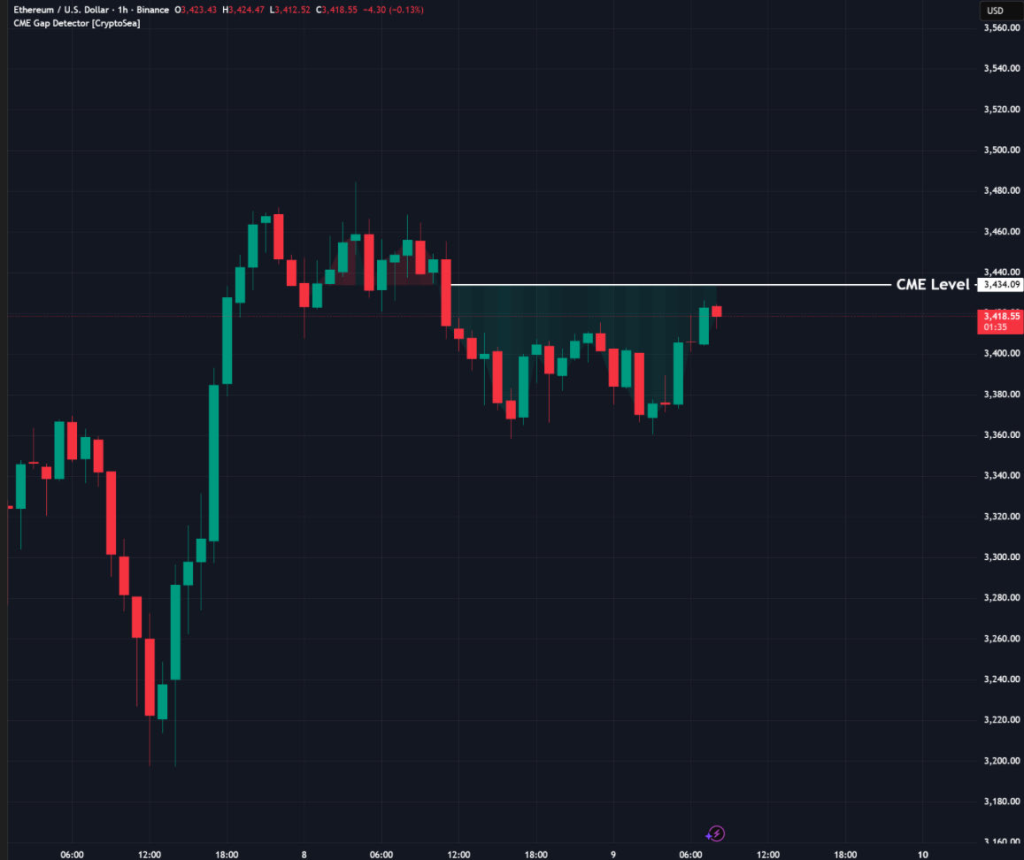
- •The price is approaching the CME gap located at $3,434, with $3,500 serving as a crucial near-term resistance to monitor.

On-chain data reveals that a significant amount of approximately 869,000 ETH was accumulated within the price range of $3,662 to $3,678. This concentration of acquisition has now formed a key resistance zone, indicating potential selling pressure as the price re-enters this band.
The cost basis heatmap, updated on November 5, further corroborates this supply cluster, highlighting a substantial number of tokens held within that specific price area. Ethereum's price has tested this level multiple times since September, but has consistently failed to sustain a position above it. These repeated rejections suggest that the market is encountering considerable difficulty in breaking past the $3,700 threshold.
Ethereum Nears CME Gap at $3,434
Analysis of the CME futures market indicates a gap at the $3,434 level, which historically tends to be revisited by spot price action at the beginning of a new trading week. Ethereum was trading just below this level, approximately at $3,398, suggesting an attempt to close the gap that emerged over the weekend.
Trading volume around this specific price area is showing an increase. Market observers suggest that this level might serve as a short-term target. One trader commented, "Expect Monday opening to be around this zone." While a complete retrace to fill the gap is not guaranteed, traders are actively monitoring this range for potential short-term trading opportunities.
Bounce From Support Zones Holds for Now
Ethereum has recently experienced a rebound from a confluence of support levels. These critical levels include the 0.618 Fibonacci retracement, situated near $3,202, along with the 200-day moving average and the 200-day EMA as observed on the 3-day chart. This convergence of support indicators has triggered a short-term price bounce.
Currently, ETH is trading near the mid-range of the $2,800 to $4,100 price corridor, an area characterized by significant historical trading activity. The Volume Profile data indicates this zone as the most active over recent months. Maintaining price levels within this range is considered important to prevent further downward price movement.
Price Range Defines Near-Term Outlook
There is immediate resistance identified near the $3,500 mark, a level that previously acted as a barrier to price increases during the market correction in October. If Ethereum is unable to surpass this zone, it may continue to trade within its current range or potentially trend lower. Should the support level around $3,200 fail to hold, a decline towards $2,800 becomes a more probable scenario.
The broader market structure presents a mixed outlook. While the weekly chart appears stable, the daily trend indicates a downward movement. Traders are closely observing this price action. One analyst cautioned, "Don’t get too bearish at support and don’t get too excited against resistance." The market is currently in a phase of observation and anticipation.