

Ethereum is approaching one of the most decisive moments of its current cycle as the market weighs two competing interpretations of its trend. Although the viewpoints differ, both analysts focus on the same defining threshold: the $2,200 support zone.
Long-Term Support Under Pressure
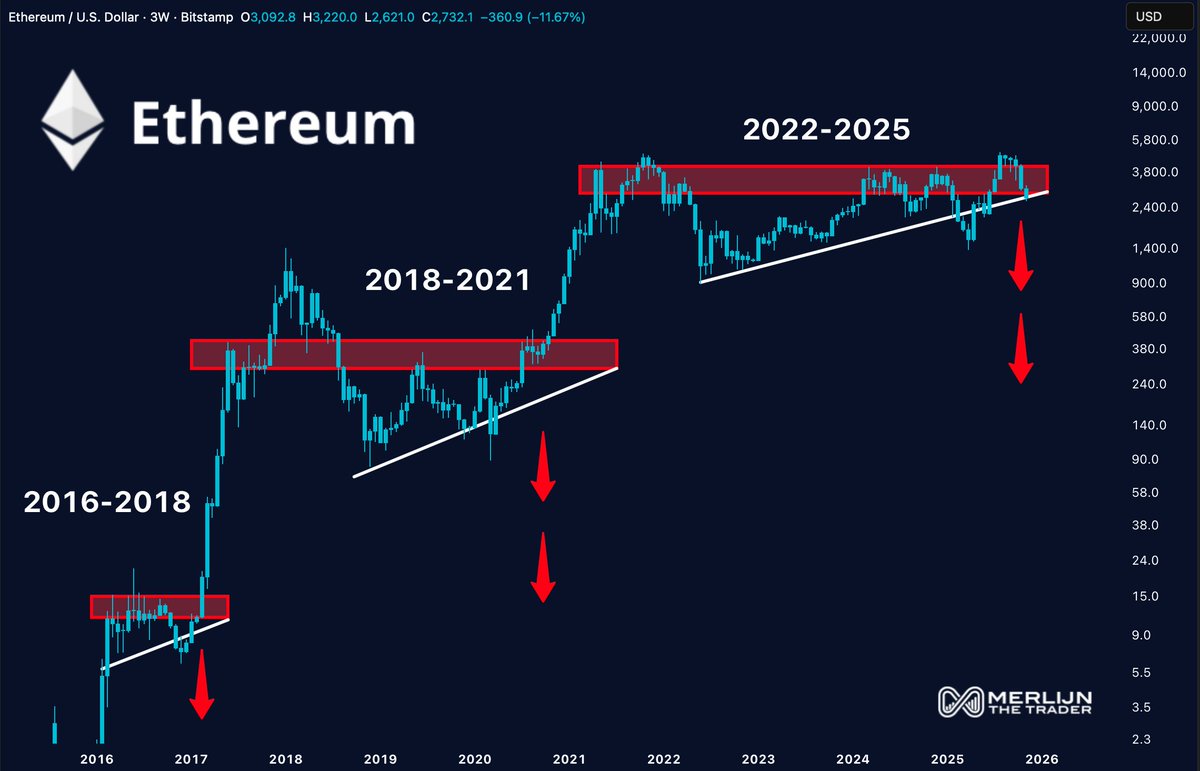
ETH has returned to a major rising support trendline that has guided every multi-year phase of its price history, from 2016–2018, through 2018–2021, and into the 2022–2025 structure.
Merlijn The Trader warns that losing this trendline would expose Ethereum to significantly lower levels, describing the zone as “the cliff.” His long-term chart highlights that previous breaks of similar structures have resulted in sharp downward moves, often faster and deeper than traders expect.
The Elliott Wave View: Structure Still Intact
Egrag Crypto’s interpretation takes the opposite direction, framing the chart within a classic five-wave Elliott impulsive pattern. In his view, ETH has moved cleanly from Wave 1 to Wave 2, driven strongly into Wave 3, and has recently completed a deep Wave 4 reset. He argues that Wave 5 remains the missing leg, and that the market structure still supports a continuation higher.
Unlike traditional markets, where Wave 4 may not overlap Wave 1 without invalidating the pattern, Egrag notes that crypto’s volatility and exchange discrepancies allow for limited overlap without breaking the count. Liquidity hunts, CME gaps, and rapid wicks make Ethereum’s wave structure more flexible compared to legacy assets.
The Make-or-Break Level: $2,200
Despite analyzing the chart through different lenses, both Merlijn and Egrag agree on one critical point: Ethereum must hold $2,200 to preserve any bullish structure.
Above that level, Egrag believes the Elliott Wave remains valid and Wave 5 stays in play. Below it, the pattern requires a full reevaluation and the bearish scenario gains power. The chart itself has repeatedly reacted to this area, reinforcing its importance as a structural anchor.
Wave 5 Scenarios and Fibonacci Targets
If ETH holds the key support and enters Wave 5, Egrag outlines three major Fibonacci extension targets:
- •1.272 extension: ~$5,731
- •1.414 extension: ~$6,246
- •1.618 extension: ~$7,067
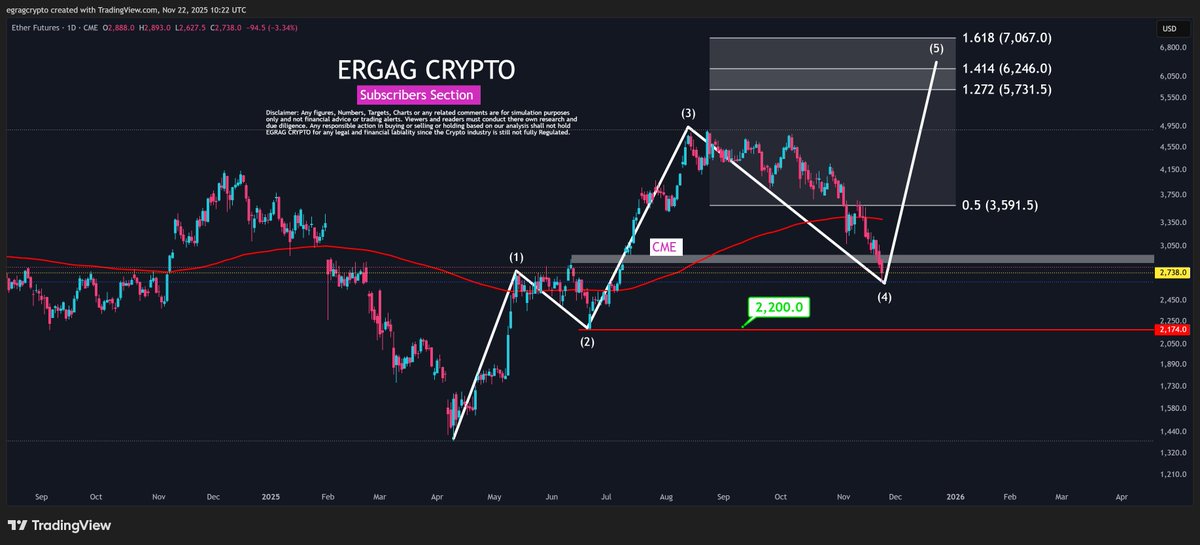
He argues that crypto markets historically produce extended Wave-5 moves, especially when Wave 3 was strong and Wave 4 retraced deeply, both of which match Ethereum’s current profile. The upper grey zone in his chart represents the full extension range that the pattern would naturally reach.
Outlook: Decision Time for Ethereum
Ethereum now stands at a crossroads.
A strong bounce from $2,200 would support the bullish Elliott Wave thesis and open the door for a significant rally into the mid-$5K to $7K zone. But a breakdown through this level would confirm Merlijn’s warning, shifting the market into a deeper corrective phase with far fewer support levels below.
With ETH sitting directly on a multi-cycle support and both bullish and bearish outcomes tightly bound to it, the next moves around this price point may determine the entire trajectory of the coming months.