

Key Insights
- •Ethereum's $3,400 support level remains firm, with traders closely monitoring the $3,570 mark for a potential breakout.
- •Exchange reserves have reached multi-month lows, indicating that holders are withdrawing ETH from platforms, which could limit selling pressure.
- •Technical indicators suggest a possible bullish crossover on the MACD as Ethereum approaches the upper boundary of a falling wedge pattern.
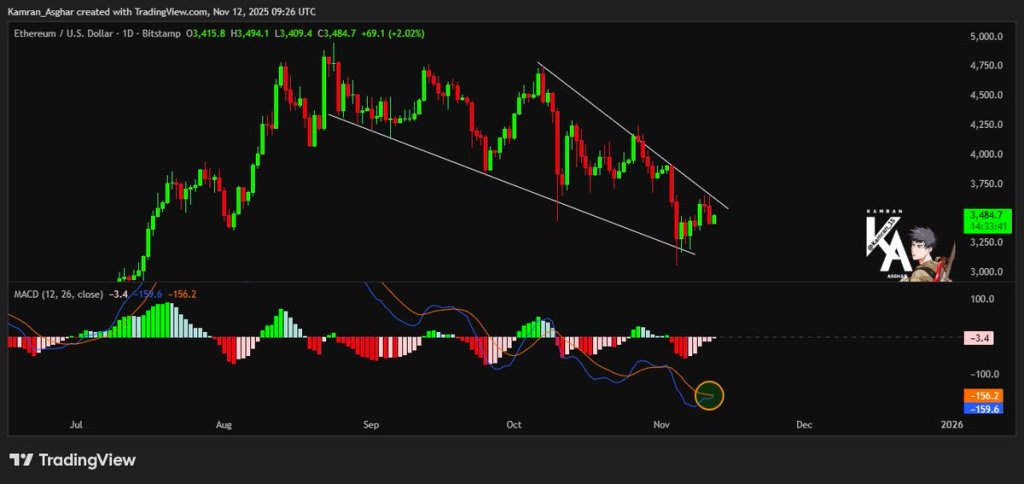
Price Action and Key Resistance Levels
Ethereum (ETH) is currently trading around $3,505.95, showing a slight daily increase of 0.18% and a 4.51% gain over the past week. The cryptocurrency has maintained its stability after testing crucial support levels, but its short-term direction is still subject to uncertainty as traders focus on two significant price zones.
ETH has successfully bounced from the $3,400 support level and is now approaching the resistance zone between $3,560 and $3,570. A decisive breakout above this range, accompanied by momentum, could lead to the next target of $3,640. This area has previously acted as a resistance point and could be a critical factor in determining the strength of any upward price movement.
Trader Lennaert Snyder commented on the situation, stating, "If Ethereum comes in the $3,570 box, I'm watching for shorts after the failure and longs after the gain."
Conversely, a rejection from this resistance range could push ETH back towards the $3,400 support level or even lower. A clear break below $3,400 might result in a test of the $3,260 level.
Technical Analysis: Wedge Pattern and MACD Crossover
On the daily chart, Ethereum is exhibiting a falling wedge pattern, a technical formation that often precedes a breakout. The price has tested both the upper and lower boundaries of this wedge, and recent price action indicates building pressure near the upper trendline.
The Moving Average Convergence Divergence (MACD) indicator shows the blue line moving upwards towards the orange signal line. This trajectory suggests a potential bullish crossover, which could signal increasing momentum for ETH.
Kamran Asghar noted this potential development, tweeting, "$ETH is loading up for liftoff. Falling Wedge on the chart, and the MACD is seconds away from a bullish cross."
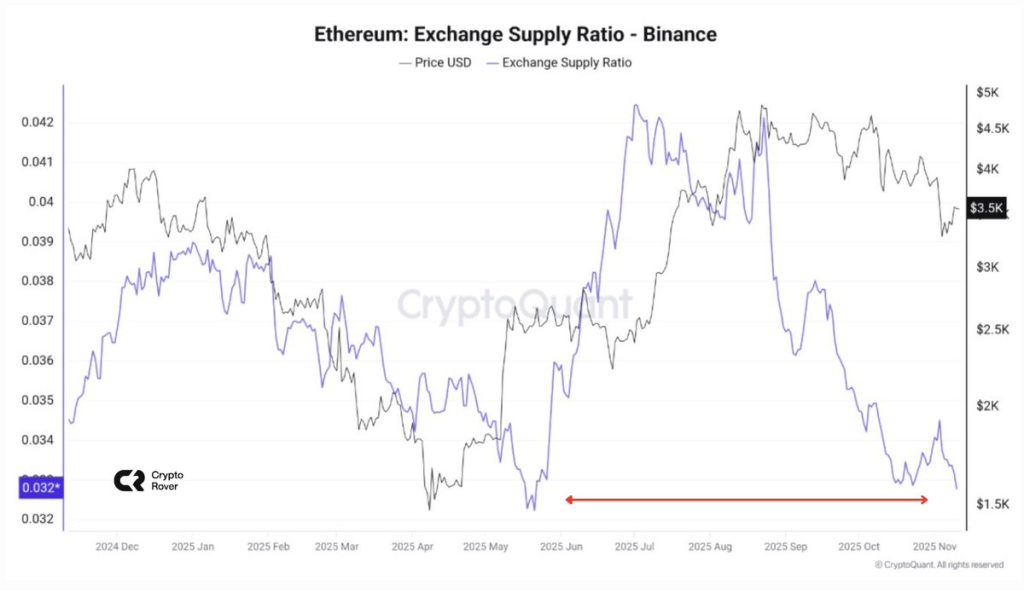
Exchange Supply Ratio Reaches Multi-Month Low
Data from CryptoQuant reveals that Ethereum's supply ratio on the Binance exchange has fallen to 0.032, a level not seen since April 2025. This metric tracks the proportion of ETH held on exchanges relative to its total supply. A declining exchange supply ratio typically signifies that more holders are moving their ETH to self-custody wallets or long-term holding addresses.
Crypto Rover shared insights on this trend, posting, "NO SELLING," suggesting a reduction in selling pressure from current holders. Despite Ethereum's significant price increase from lows around $1,500 to its current level above $3,500, the supply on exchanges continues to decrease. This trend implies that a considerable number of users may not be preparing to sell their holdings.
Market Awaiting Next Directional Trigger
Ethereum's price is currently positioned between well-defined support and resistance levels. Traders are anticipating a clear move above $3,570 or a break below $3,400 to confirm the next directional trend. Until such a move occurs, ETH may continue to trade within a range, with the price direction of Bitcoin likely to influence short-term fluctuations.