

Ethereum's Current Market Performance
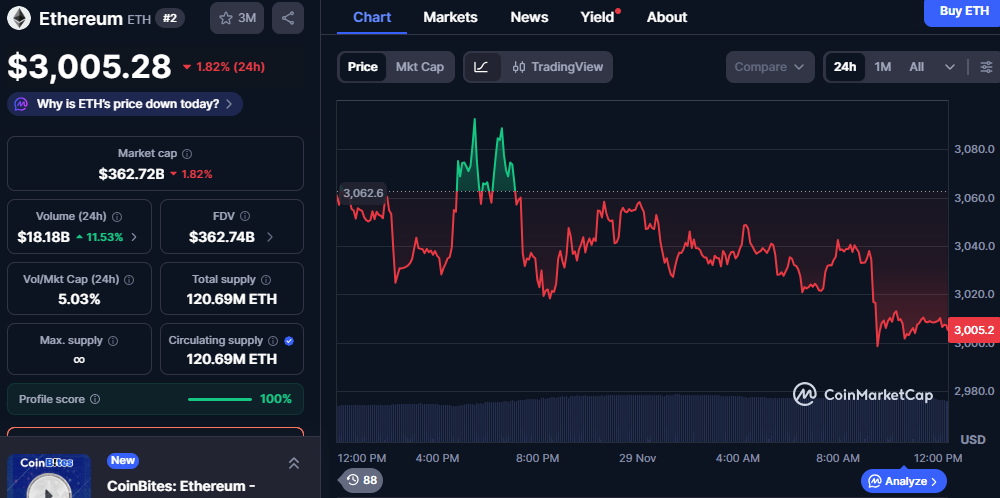
Ethereum (ETH) is currently experiencing a price decline, trading at $3,005.28, marking a 1.82% decrease in the past 24 hours. The price has fluctuated throughout the day, dipping from over $3,060 to below the $3,000 mark. Technical analysis suggests that Ethereum could continue its downward trajectory, possibly testing the $2,930 to $2,970 support zone before any potential upward movement.
The market capitalization of Ethereum stands at $362.72 billion, reflecting the current decrease in price. Despite the decline, Ethereum maintains a dominant position in the market, underscoring its strength as a leading cryptocurrency. With a circulating supply of 120.69 million ETH, the cryptocurrency’s liquidity remains stable, but its current price volatility raises concerns about short-term price action.
The 24-hour trading volume has risen by 11.53%, reaching $18.18 billion, indicating active market participation despite the price downturn. This uptick in volume suggests a heightened level of trading activity as Ethereum continues to test lower levels. Market sentiment remains divided, with increased interest in Ethereum despite its bearish price movement, suggesting that traders are positioning themselves for a possible reversal in the near future.
Technical Analysis: Downward Movement and Potential Reversal
Ethereum’s price action on the 24-hour chart shows a bearish trend, with a steady decline from recent highs above $3,060. This drop aligns with the trader’s expectations, who anticipates a further decline toward the $2,930 – $2,970 region. The analysis suggests that this level will serve as key support, where the price may consolidate before any potential recovery.
The trader’s outlook is based on technical factors, including the current position of Ethereum relative to key moving averages. Ethereum is trading below its significant price levels, indicating that sellers are in control in the short term. As the price approaches the $2,930 region, it is expected to meet strong support, which may stabilize the price and set the stage for an upward correction.
Ethereum’s Relative Strength Index (RSI) has also been showing signs of weakening, further reinforcing the bearish sentiment. If the price reaches the $2,930 support zone, it may experience a brief consolidation before beginning an upward move. The trader’s analysis aligns with Elliott Wave patterns, where the market is expected to complete a corrective wave before initiating the next bullish leg.
$ETH / $USD – Update
— Crypto Tony (@CryptoTony__) November 29, 2025
I am currently short below $3041 and i am expecting us to tap lower into the $2970 – $2930 region before upside pic.twitter.com/oYvJac2C4Y
Ethereum’s Outlook: Testing Support Before Bullish Momentum
The key to Ethereum’s price action lies in its ability to hold the $2,930 support level. If Ethereum holds this range, it could set the stage for a potential price rebound. The trader anticipates that once the support is tested, Ethereum may experience a surge in demand, pushing the price higher in the coming weeks.
This bearish-to-bullish scenario is not uncommon in market cycles, where prices often consolidate at lower levels before rebounding. Ethereum’s current price movement aligns with common market patterns, which often precede upward trends. Monitoring Ethereum’s price near these key support zones will be critical to understanding the direction of its next move.