

Ethereum is currently trading near $2,803, having lost the critical $2,900 support level. Derivatives data indicates high trading volumes and a decline in open interest, suggesting a rapid exit from existing positions. On-chain data and whale activity further point towards persistent selling pressure, despite anticipation surrounding the upcoming Fusaka upgrade.
The second-largest cryptocurrency was trading at $2,803 at press time, marking a decline of approximately 0.9% in the past day and about 5% over the week. The month-to-date slide is now close to 28%, positioning ETH roughly 43% below its all-time high of $4,946, which was set in August.
Market activity has increased even as the price experiences a downturn. Trading volume has risen by 46% to $30 billion in the last 24 hours, indicating heightened trader engagement. Data from CoinGlass also shows that Ethereum (ETH) derivatives volume has increased by 19% to $70 billion, while open interest has decreased by 4%.
A rise in volume coupled with a drop in open interest typically signifies that traders are closing out existing positions rather than initiating new long or short trades.
CryptoQuant Data Confirms Breakdown
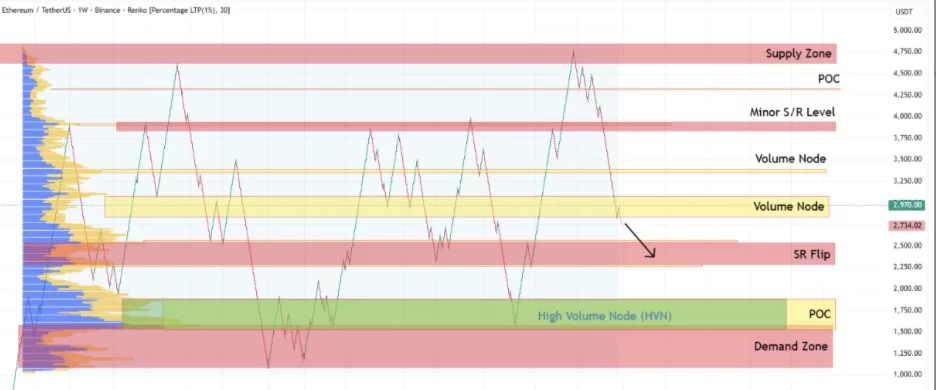
On-chain indicators align with the bearish technical trend. According to an analysis by CryptoQuant contributor CryptoOnchain on December 2, Ethereum has decisively broken through the $2,900 volume node, a level that had served as robust support for several months.
Ethereum's Renko chart now displays a clear bearish bias, suggesting that a potential support area lies around $2,250. This shift in market structure increases the probability of a continued price pullback.
Further supporting this bearish outlook are signals from Binance flows. The Bitcoin Exchange Whale Ratio has seen a significant increase, indicating that large holders are responsible for the majority of inflows into the exchange.
When whales heavily influence exchange activity, it often suggests preparations for a potential downturn through increased selling or hedging. Given that Bitcoin typically leads the market trends, concentrated whale outflows on Bitcoin can create indirect downward pressure on Ethereum.
Concurrently, the decline in open interest on Ethereum reinforces the notion that traders are exiting their positions rather than defending the recently breached support level.
Fusaka Upgrade Poised to Influence Sentiment
The Fusaka upgrade, scheduled for December 3, represents a significant advancement in Ethereum's long-term scaling strategy. Its primary objectives include reducing data load, decreasing transaction costs for rollups, and enhancing the efficiency of block space.
Peer Data Availability Sampling will enable nodes to validate blob data without needing to download the entire payload. This mechanism is designed to lower resource requirements and support higher throughput for rollup solutions.
The upgrade also incorporates expanded blob capacity, revised fee mechanisms, more efficient historical data storage, and improved proposer scheduling. Collectively, these enhancements aim to make the base layer faster and more predictable, while simultaneously reducing costs for users.
While these changes are beneficial for Ethereum's long-term development, they may not immediately counteract the current bearish market setup. However, if the resulting lower fees and increased throughput attract greater on-chain activity, it could lead to higher fee burns, thereby improving ETH's economic profile and potentially supporting a future recovery.
Ethereum Price Technical Analysis
The current technical chart clearly indicates a downtrend, with the price consistently trading below all major moving averages. Both short-term and long-term averages signal ongoing selling pressure. Following a sharp decline, the Bollinger Bands have widened, and the relative strength index (RSI) is positioned around 33, showing no immediate signs of a reversal.
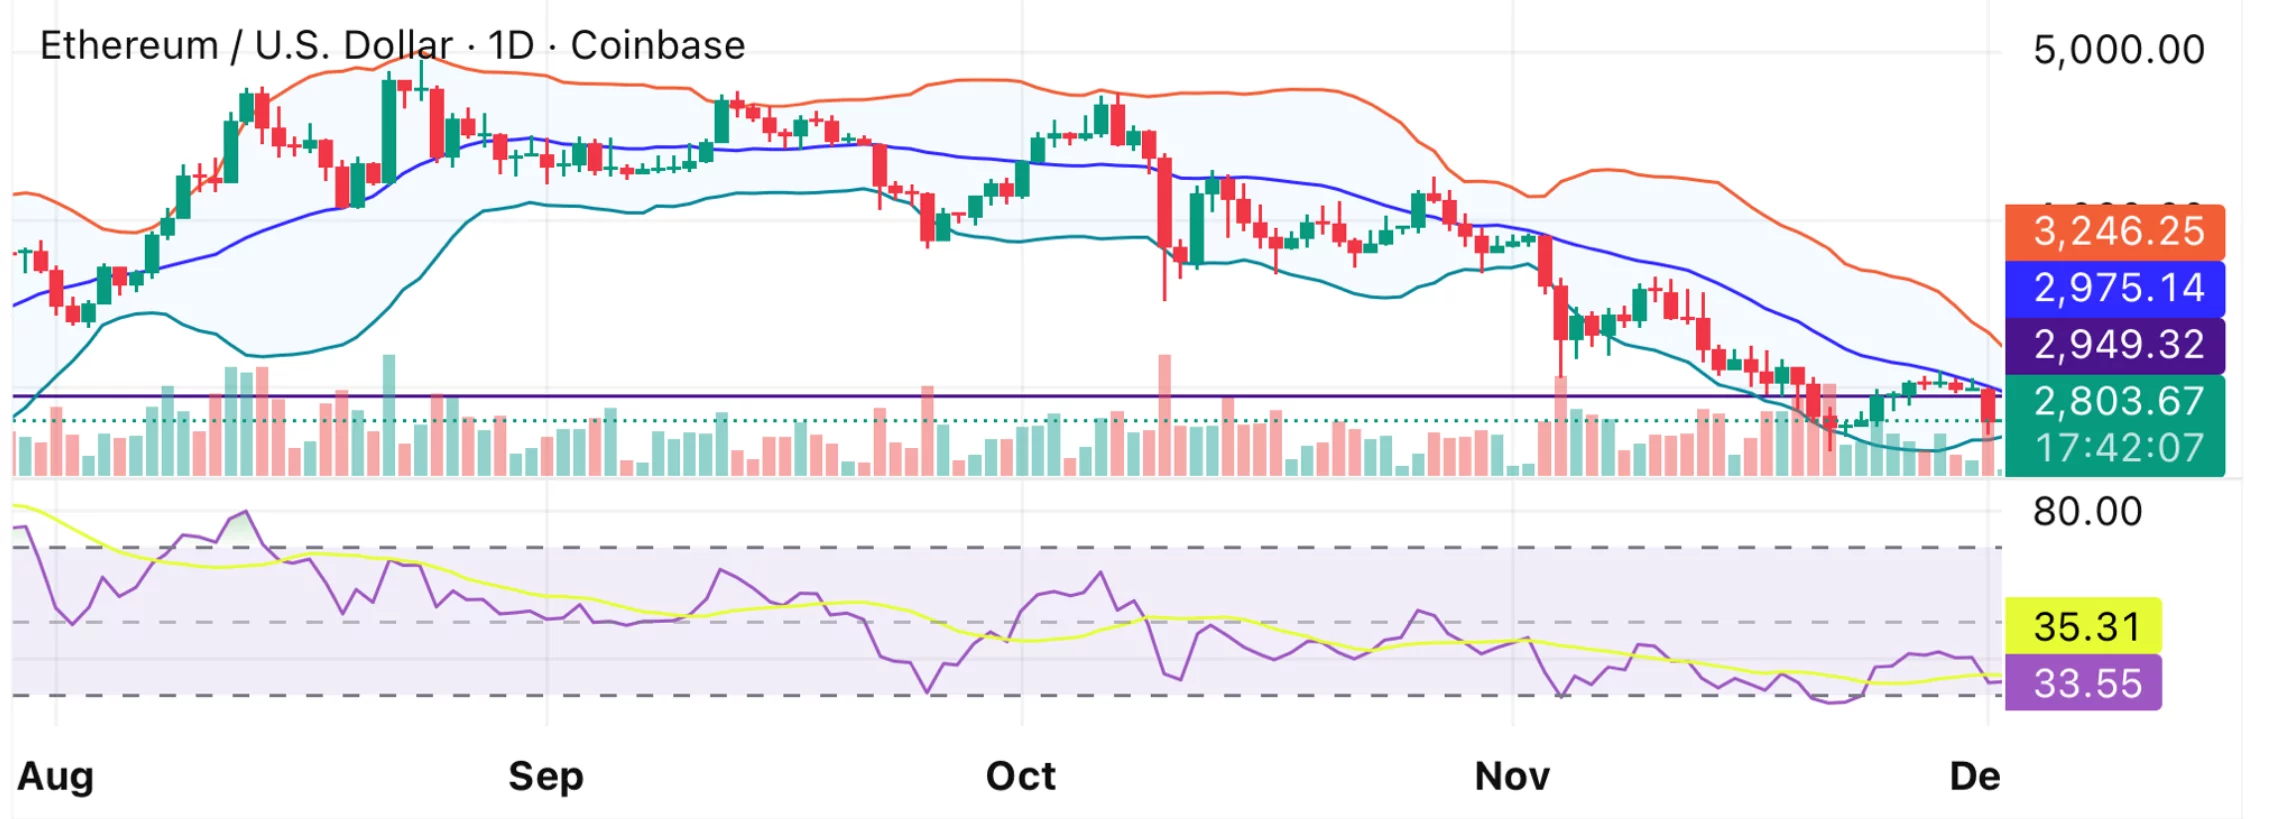
The Moving Average Convergence Divergence (MACD) indicator remains negative, although it is showing signs of flattening. The Commodity Channel Index (CCI) leans towards neutral, while the stochastic oscillator is situated in the low-to-mid range, lacking strong momentum.
Immediate support is identified near the $2,700 level, with deeper support expected around $2,250. For bulls to shift the current momentum, a clear reclaim of the $3,000 zone is necessary. Conversely, remaining below this range sustains the prevailing bearish trajectory.