

Ethereum has made a strong push over the past two sessions, briefly tapping the $3,400 area before slowing down. This move came right in line with Bitcoin’s recent strength and confirms that buyers are still in control of higher timeframes.
On the 4-hour chart, Ethereum clearly flipped structure to the upside after breaking out from the $3,100–$3,150 range. Currently, the ETH price is no longer accelerating. It is sitting just below resistance and beginning to compress, which typically signifies that the next significant move is being decided.
What the ETH 4-Hour Chart Is Telling Us
On the 4-hour chart, the range is quite clear. The $3,400–$3,450 zone stands out as a weak weekly high. Ethereum has already tested this area once and stalled, indicating that sellers are present but not strong enough to push the price lower in any meaningful way.
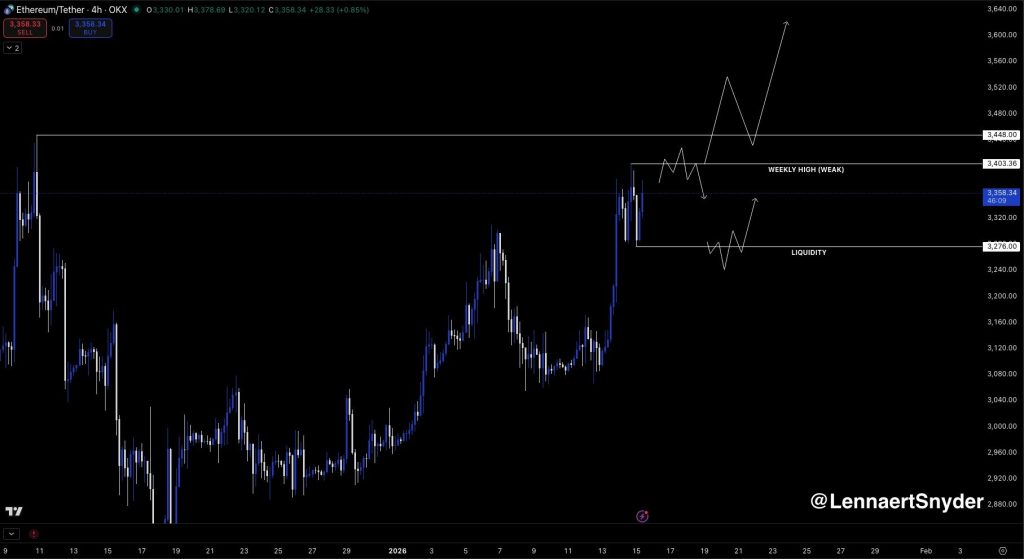
If the ETH price can reclaim this zone on a 4-hour close, it would signal acceptance above resistance and shift momentum back into the bulls’ favor.
On the downside, liquidity is situated around $3,270. This level aligns with the most recent higher low and is a potential spot where late longs could be shaken out. A quick dip below $3,270 followed by a reclaim would align with the current bullish structure and often sets up the next push higher.
The Main Scenarios in Play
If the ETH price drops into the $3,270 area, the focus will shift to its reaction at that level. A clean structure break on lower timeframes after such a sweep would indicate that buyers are stepping back in. In that scenario, a move back toward the recent highs would become the base case.
If the price returns to $3,400, the significance lies not in the level itself, but in how Ethereum reacts there. A rejection could trigger a short-term pullback, but as long as the broader structure remains intact, that move would still be considered against the trend. Conversely, a clean 4-hour reclaim above this area would put momentum back on the bulls’ side.
The most likely positive outcome would be a clean breakout above $3,450 on the 4-hour chart, with a subsequent hold at this level. If Ethereum achieves this, the subsequent level to move above would be approximately $3,600, which aligns with the chart's indications.
What’s Next for ETH?
Overall, the ETH price still appears healthy. While the pace has slowed after the breakout, the underlying structure has not changed. As long as Ethereum remains above approximately $3,270, any pullbacks should be viewed as brief pauses rather than definitive reversals. Once it is able to break and close above around $3,450, that would likely signal the commencement of the next upward thrust.