

Key Market Insights
- •Ethereum faces immediate resistance at $3,180 and strong support near $2,800, where approximately 2.60 million ETH were accumulated.
- •Analysts observe improving buyer behavior, with higher lows suggesting potential momentum toward $3,700.
- •The Relative Strength Index (RSI) is recovering, and a positive Moving Average Convergence Divergence (MACD) crossover indicates strengthening bullish momentum following a period of decline.
The current market recovery follows several weeks of significant selling. This rebound now coincides with improving technical signals and strong on-chain buy zones that have begun to stabilize market sentiment.
Accumulation Zones Shape the Market’s Near-Term Landscape
Fresh cost-basis distribution data reveals that one of the largest clusters of holder positioning is situated near $2,800. Approximately 2.60 million ETH were accumulated in this range, establishing a structural support zone that has repeatedly absorbed sell pressure throughout the autumn downturn.
At the upper end of the current trading range, $3,180 continues to stand out as the dominant resistance level, defining Ethereum’s path between buyer confidence and overhead supply.
Analysts Observe Buyers Stepping In at Higher Levels
Market strategists are closely monitoring price behavior around the $3,150–$3,180 zone. Michaël van de Poppe notes that buyers are "stepping in at higher grounds than last week," a pattern he interprets as a constructive shift toward bullish continuation.
If this trend persists, he projects that Ethereum could be positioning for a move toward $3,700 as the next significant target zone.
I'd love to see $ETH hold this previous resistance zone as support.
What does that say?
Well, it does say that buyers are willing to be stepping in on higher grounds than last week and that would signal a potential rally to $3,700. pic.twitter.com/tWjrviMBZq
— Michaël van de Poppe (@CryptoMichNL) December 4, 2025
RSI and MACD Signal Strength After Weeks of Weakness
Technical indicators are now reflecting a market that is regaining traction. Ethereum’s Relative Strength Index (RSI) has recovered to the mid-50s, signaling improving buy-side momentum.
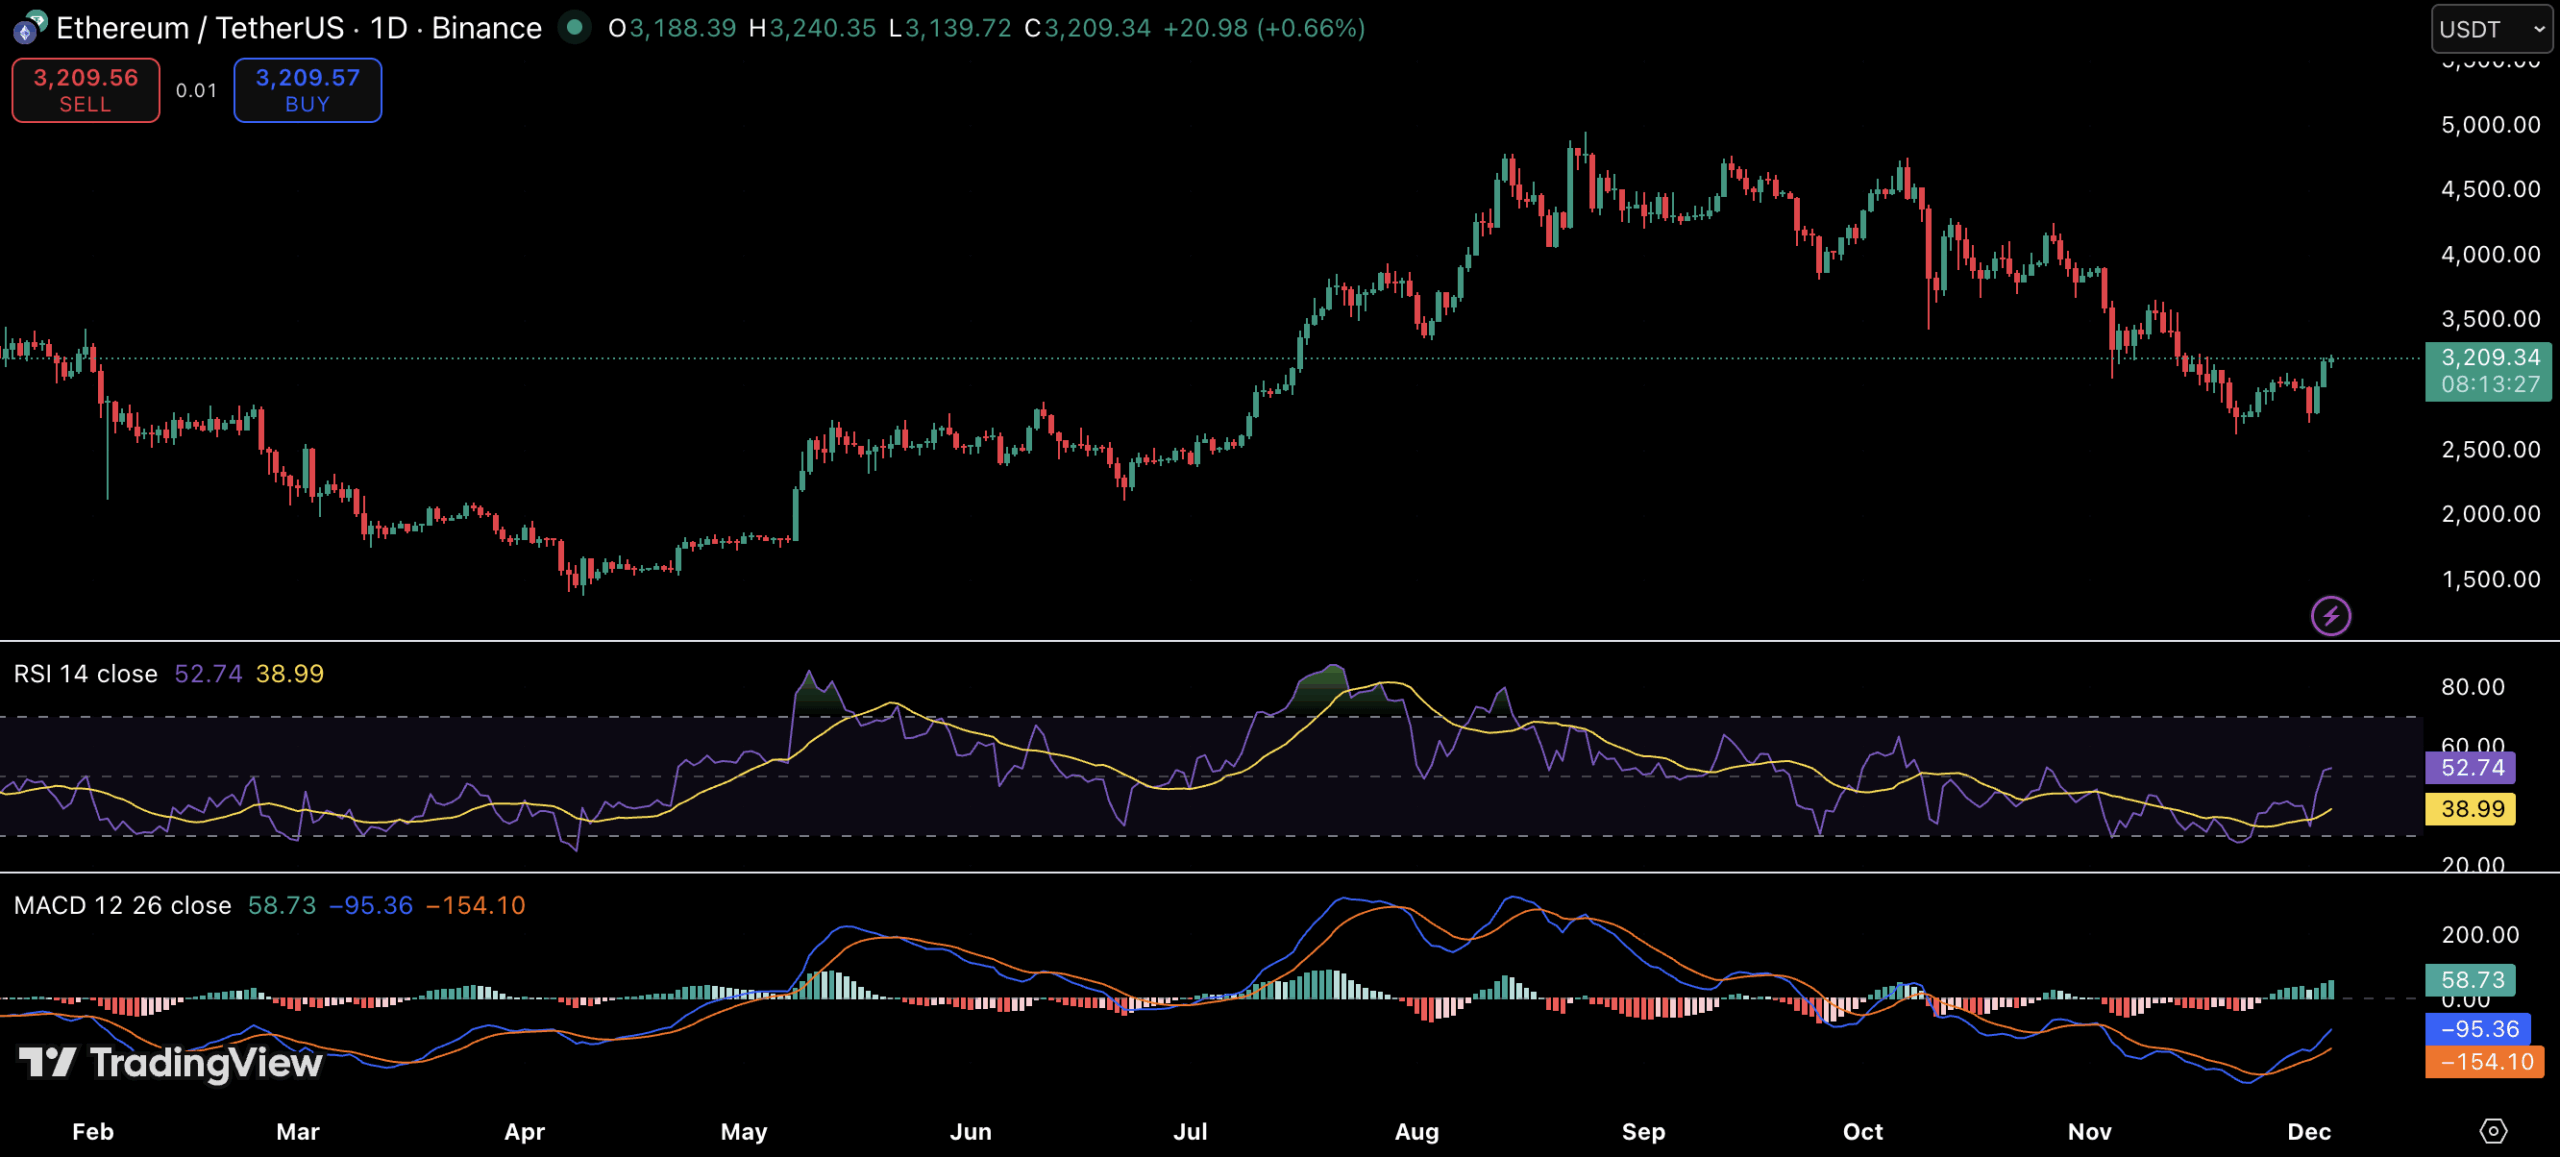
Meanwhile, the MACD has generated a bullish crossover after spending most of November in deeply negative territory. These shifts commonly occur early in recovery phases, suggesting that the recent bounce may have sustained momentum if key resistance levels are broken.
Can Ethereum Break Above $3,180?
For the immediate future, the market's trajectory depends on Ethereum's capacity to decisively surpass the $3,180 barrier. A breakout above this level would pave the way for a more extended rally, whereas a rejection could lead to a price pullback into the support bands near $2,800.
Two key levels to watch for Ethereum:
• $3,180 as resistance
• $2,800 as supportRoughly 2.60 million $ETH were accumulated at each level. pic.twitter.com/UcbfJsUMVX
— Ali (@ali_charts) December 4, 2025
Given heightened volatility and ongoing macro uncertainties, traders are closely observing these two levels as defining markers for Ethereum’s outlook in December.